SOHO MDI 2000-01-12 15:59:32 UT
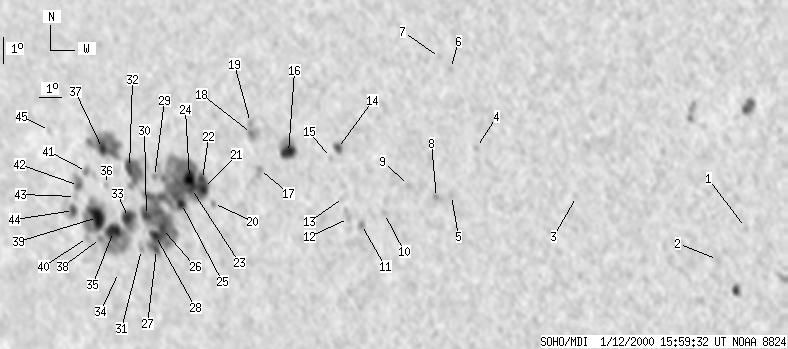
| group | Proj. U | Proj. WS | Corr. U | Corr. WS | B | L | LCM | Pos. angle | r |
| 170 | 1086 | 112 | 714 | -12.84 | 174.15 | -40.44 | 105.01 | 0.6549 | |
|
previous
or next day for the same group /
back to the solar disc SOHO MDI 2000-01-12 15:59:32 UT |
| spot | Proj. U | Proj. WS | Corr. U | Corr. WS | B | L | LCM | Pos. angle | r |
| 0 | 8 | 0 | 4 | -15.03 | 199.57 | -15.01 | 127.11 | 0.3152 | |
| 0 | 10 | 0 | 5 | -16.25 | 198.32 | -16.26 | 128.08 | 0.3431 | |
| 0 | 5 | 0 | 3 | -13.66 | 192.65 | -21.94 | 114.92 | 0.4021 | |
| 0 | 5 | 0 | 3 | -11.64 | 188.56 | -26.03 | 107.55 | 0.4528 | |
| 0 | 2 | 0 | 1 | -13.46 | 187.25 | -27.33 | 110.62 | 0.4791 | |
| 0 | 4 | 0 | 2 | -8.57 | 187.70 | -26.89 | 100.54 | 0.4568 | |
| 0 | 8 | 0 | 5 | -8.13 | 187.25 | -27.33 | 99.48 | 0.4628 | |
| 0 | 8 | 0 | 4 | -13.51 | 186.58 | -28.01 | 110.35 | 0.4890 | |
| 0 | 4 | 0 | 2 | -13.01 | 185.39 | -29.20 | 108.75 | 0.5040 | |
| 0 | 4 | 0 | 2 | -14.05 | 184.16 | -30.43 | 110.12 | 0.5255 | |
| 0 | 7 | 0 | 4 | -14.44 | 183.04 | -31.55 | 110.30 | 0.5425 | |
| 0 | 10 | 0 | 6 | -14.18 | 182.47 | -32.12 | 109.59 | 0.5493 | |
| 0 | 9 | 0 | 5 | -13.36 | 182.36 | -32.22 | 108.08 | 0.5479 | |
| 4 | 12 | 2 | 7 | -11.46 | 182.35 | -32.24 | 104.65 | 0.5425 | |
| 0 | 5 | 0 | 3 | -11.80 | 181.98 | -32.61 | 105.14 | 0.5486 | |
| 17 | 44 | 10 | 26 | -11.52 | 180.05 | -34.54 | 104.08 | 0.5750 | |
| 0 | 11 | 0 | 7 | -12.12 | 178.57 | -36.02 | 104.69 | 0.5967 | |
| 0 | 17 | 0 | 11 | -10.72 | 178.39 | -36.20 | 102.31 | 0.5963 | |
| 0 | 6 | 0 | 4 | -10.30 | 178.40 | -36.19 | 101.61 | 0.5954 | |
| 0 | 5 | 0 | 3 | -13.33 | 176.09 | -38.50 | 105.98 | 0.6325 | |
| 19 | 472 | 12 | 308 | -12.73 | 175.69 | -38.90 | 104.94 | 0.6362 | |
| -21 | -21 | -21 | -21 | -12.38 | 175.70 | -38.88 | 104.40 | 0.6354 | |
| 7 | -21 | 4 | -21 | -12.70 | 175.09 | -39.50 | 104.76 | 0.6440 | |
| 12 | -21 | 8 | -21 | -12.31 | 175.06 | -39.53 | 104.15 | 0.6436 | |
| 7 | -21 | 5 | -21 | -13.26 | 174.47 | -40.12 | 105.46 | 0.6531 | |
| 4 | -21 | 3 | -21 | -14.17 | 173.28 | -41.30 | 106.55 | 0.6700 | |
| 4 | -21 | 3 | -21 | -14.97 | 172.78 | -41.81 | 107.59 | 0.6780 | |
| 7 | -21 | 5 | -21 | -14.43 | 172.86 | -41.73 | 106.82 | 0.6758 | |
| 0 | 8 | 0 | 6 | -12.15 | 173.28 | -41.31 | 103.54 | 0.6661 | |
| 9 | -21 | 6 | -21 | -13.63 | 172.56 | -42.03 | 105.59 | 0.6779 | |
| 0 | 6 | 0 | 4 | -14.93 | 171.99 | -42.60 | 107.34 | 0.6876 | |
| 11 | 79 | 7 | 53 | -11.74 | 172.04 | -42.55 | 102.72 | 0.6811 | |
| 16 | 29 | 11 | 20 | -13.66 | 171.59 | -43.00 | 105.42 | 0.6899 | |
| 0 | 3 | 0 | 2 | -15.76 | 170.51 | -44.08 | 108.16 | 0.7069 | |
| 14 | 73 | 10 | 51 | -14.16 | 170.65 | -43.94 | 105.94 | 0.7021 | |
| 0 | 3 | 0 | 2 | -12.33 | 170.68 | -43.90 | 103.35 | 0.6987 | |
| 6 | 90 | 4 | 62 | -10.94 | 170.74 | -43.84 | 101.37 | 0.6961 | |
| 0 | 6 | 0 | 5 | -14.40 | 169.87 | -44.72 | 106.11 | 0.7118 | |
| 25 | 77 | 17 | 54 | -13.58 | 169.91 | -44.68 | 104.98 | 0.7099 | |
| 0 | 7 | 0 | 5 | -14.32 | 169.16 | -45.43 | 105.87 | 0.7200 | |
| 0 | 6 | 0 | 5 | -11.78 | 169.70 | -44.89 | 102.42 | 0.7098 | |
| 3 | 19 | 2 | 14 | -12.29 | 169.14 | -45.44 | 103.06 | 0.7171 | |
| 0 | 5 | 0 | 3 | -12.71 | 168.88 | -45.71 | 103.59 | 0.7207 | |
| 5 | 15 | 3 | 10 | -13.24 | 168.64 | -45.95 | 104.29 | 0.7243 | |
| 0 | 4 | 0 | 3 | -10.10 | 167.96 | -46.63 | 99.89 | 0.7288 | |
| Proj. U | - Projected umbra area in millionths of solar disc, negative values indicate | |
|
that the umbra consists of fragmented regions which cannot be separated without losing umbral area. In this way several spots (intensity minima in the umbra) have a common umbra, e.g. -2 means that the given spot shares an umbra with spot No.2, and the common U value is indicated at spot No.2. |
||
| Proj. WS | - Projected whole spot area in millionths of solar disc, negative values indicate | |
|
that several umbras have a common penumbra, e.g. -7 means that the given umbra shares a penumbra with umbra No.7, and the WS value is indicated at No.7. |
||
| Corr. U | - Corrected umbra area in millionths of solar hemisphere, for negative values see above | |
| Corr. WS | - Corrected whole spot area in millionths of solar hemisphere, for negative values see above | |
| B | - Heliographic latitude B; positive: North, negative: South | |
| L | - Heliographic longitude L | |
| LCM | - Longitudinal distance from the Sun's central meridian | |
| Pos. angle | - Position angle | |
| r | - Distance from the centre of Sun's disc in terms of Sun's radius | |