Gyula 2000-02-27 13:13:45 UT
| group | Proj. U | Proj. WS | Corr. U | Corr. WS | B | L | LCM | Pos. angle | r |
| 297 | 2512 | 148 | 1260 | -16.02 | 330.04 | -0.16 | 179.03 | 0.1631 | |
|
previous
or next day for the same group /
back to the solar disc Gyula 2000-02-27 13:13:45 UT |
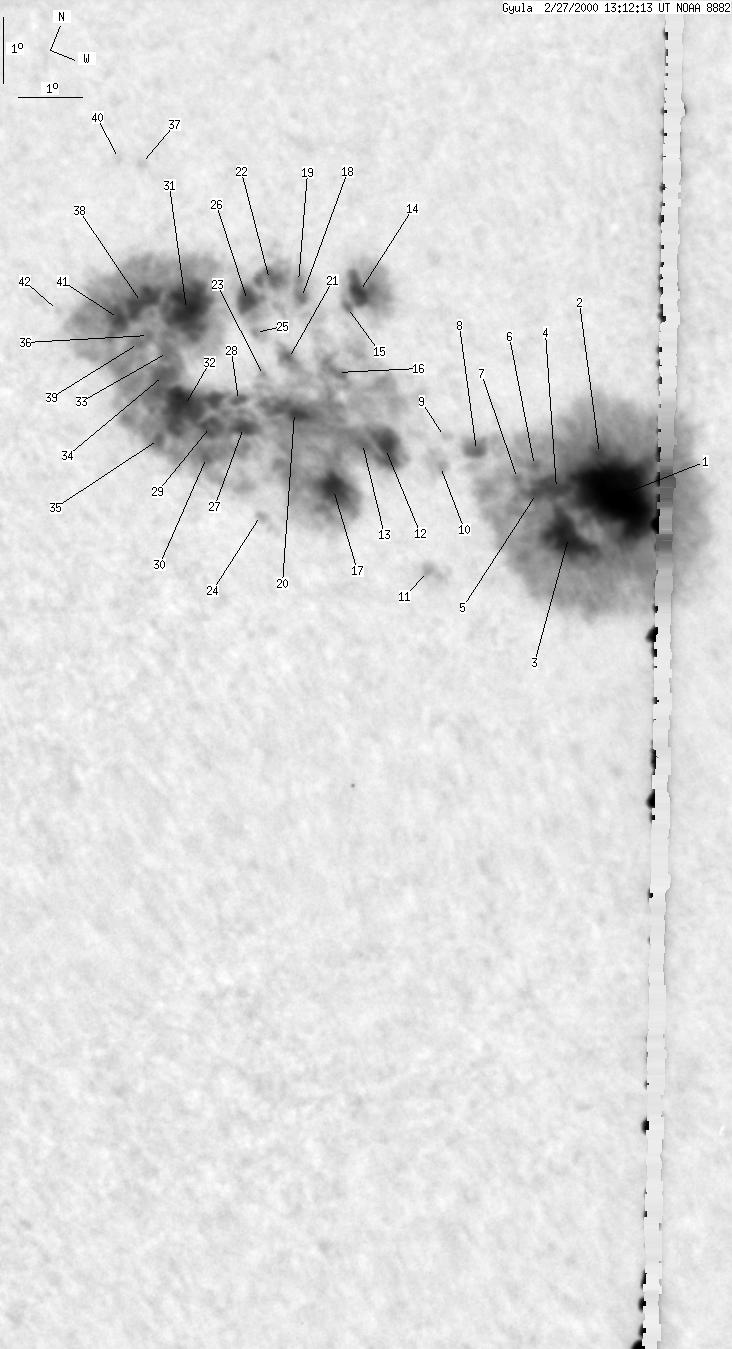
| spot | Proj. U | Proj. WS | Corr. U | Corr. WS | B | L | LCM | Pos. angle | r |
| 73 | 960 | 37 | 482 | -15.68 | 333.92 | 3.71 | 202.81 | 0.1613 | |
| 3 | -1 | 1 | -1 | -15.16 | 333.43 | 3.22 | 201.31 | 0.1498 | |
| 24 | -1 | 12 | -1 | -16.55 | 333.48 | 3.29 | 198.63 | 0.1727 | |
| 2 | -1 | 1 | -1 | -15.95 | 333.02 | 2.82 | 197.25 | 0.1604 | |
| 2 | -1 | 1 | -1 | -16.10 | 332.74 | 2.53 | 195.29 | 0.1614 | |
| 0 | -1 | 0 | -1 | -15.69 | 332.52 | 2.31 | 194.69 | 0.1537 | |
| 0 | -1 | 0 | -1 | -15.97 | 332.35 | 2.14 | 193.23 | 0.1577 | |
| 1 | -1 | 1 | -1 | -15.85 | 331.62 | 1.42 | 188.99 | 0.1533 | |
| 0 | 1 | 0 | 1 | -15.82 | 331.11 | 0.91 | 185.82 | 0.1515 | |
| 0 | 11 | 0 | 6 | -16.31 | 331.20 | 1.00 | 186.05 | 0.1601 | |
| 0 | 5 | 0 | 2 | -17.93 | 331.63 | 1.43 | 187.24 | 0.1888 | |
| 16 | 1525 | 8 | 765 | -16.33 | 330.29 | 0.09 | 180.56 | 0.1597 | |
| 4 | -12 | 2 | -12 | -16.46 | 329.93 | -0.27 | 178.39 | 0.1620 | |
| 7 | -12 | 3 | -12 | -14.29 | 329.04 | -1.16 | 170.99 | 0.1258 | |
| 1 | -12 | 0 | -12 | -14.55 | 328.94 | -1.26 | 170.59 | 0.1306 | |
| 3 | -12 | 1 | -12 | -15.50 | 329.12 | -1.10 | 172.73 | 0.1464 | |
| 15 | -12 | 7 | -12 | -17.23 | 329.77 | -0.43 | 177.64 | 0.1754 | |
| 2 | -12 | 1 | -12 | -14.67 | 328.18 | -2.02 | 165.31 | 0.1353 | |
| 1 | -12 | 1 | -12 | -14.43 | 328.03 | -2.18 | 163.71 | 0.1320 | |
| 10 | -12 | 5 | -12 | -16.40 | 328.77 | -1.43 | 171.52 | 0.1626 | |
| 3 | -12 | 2 | -12 | -15.60 | 328.31 | -1.89 | 167.76 | 0.1504 | |
| 10 | -12 | 5 | -12 | -14.62 | 327.58 | -2.62 | 161.15 | 0.1376 | |
| 2 | -12 | 1 | -12 | -15.96 | 328.05 | -2.16 | 166.64 | 0.1575 | |
| 0 | 6 | 0 | 3 | -18.01 | 328.83 | -1.37 | 173.12 | 0.1901 | |
| 1 | -12 | 0 | -12 | -15.44 | 327.71 | -2.49 | 163.73 | 0.1503 | |
| 9 | -12 | 4 | -12 | -15.06 | 327.40 | -2.80 | 161.03 | 0.1456 | |
| 5 | -12 | 3 | -12 | -16.90 | 328.07 | -2.13 | 168.11 | 0.1732 | |
| 2 | -12 | 1 | -12 | -16.50 | 327.83 | -2.37 | 166.27 | 0.1675 | |
| 4 | -12 | 2 | -12 | -17.04 | 327.59 | -2.61 | 165.72 | 0.1775 | |
| 1 | -12 | 1 | -12 | -17.54 | 327.73 | -2.47 | 167.10 | 0.1852 | |
| 35 | -12 | 17 | -12 | -15.52 | 326.65 | -3.55 | 157.64 | 0.1576 | |
| 32 | -12 | 16 | -12 | -16.92 | 327.12 | -3.08 | 163.10 | 0.1776 | |
| 5 | -12 | 2 | -12 | -16.23 | 326.53 | -3.67 | 158.69 | 0.1697 | |
| 5 | -12 | 3 | -12 | -16.55 | 326.61 | -3.59 | 159.77 | 0.1744 | |
| 2 | -12 | 1 | -12 | -17.47 | 326.87 | -3.34 | 162.73 | 0.1880 | |
| 1 | -12 | 1 | -12 | -16.03 | 326.14 | -4.07 | 156.11 | 0.1693 | |
| 0 | 2 | 0 | 1 | -13.63 | 325.09 | -5.12 | 142.40 | 0.1429 | |
| 9 | -12 | 5 | -12 | -15.70 | 325.88 | -4.32 | 153.95 | 0.1658 | |
| 2 | -12 | 1 | -12 | -16.20 | 326.04 | -4.17 | 156.00 | 0.1726 | |
| 0 | 1 | 0 | 0 | -13.72 | 324.74 | -5.47 | 140.95 | 0.1478 | |
| 5 | -12 | 2 | -12 | -16.04 | 325.67 | -4.53 | 153.80 | 0.1727 | |
| 0 | 1 | 0 | 0 | -16.18 | 324.66 | -5.55 | 149.36 | 0.1831 | |
| Proj. U | - Projected umbra area in millionths of solar disc, negative values indicate | |
|
that the umbra consists of fragmented regions which cannot be separated without losing umbral area. In this way several spots (intensity minima in the umbra) have a common umbra, e.g. -2 means that the given spot shares an umbra with spot No.2, and the common U value is indicated at spot No.2. |
||
| Proj. WS | - Projected whole spot area in millionths of solar disc, negative values indicate | |
|
that several umbras have a common penumbra, e.g. -7 means that the given umbra shares a penumbra with umbra No.7, and the WS value is indicated at No.7. |
||
| Corr. U | - Corrected umbra area in millionths of solar hemisphere, for negative values see above | |
| Corr. WS | - Corrected whole spot area in millionths of solar hemisphere, for negative values see above | |
| B | - Heliographic latitude B; positive: North, negative: South | |
| L | - Heliographic longitude L | |
| LCM | - Longitudinal distance from the Sun's central meridian | |
| Pos. angle | - Position angle | |
| r | - Distance from the centre of Sun's disc in terms of Sun's radius | |