Gyula 2000-02-29 12:59:45 UT
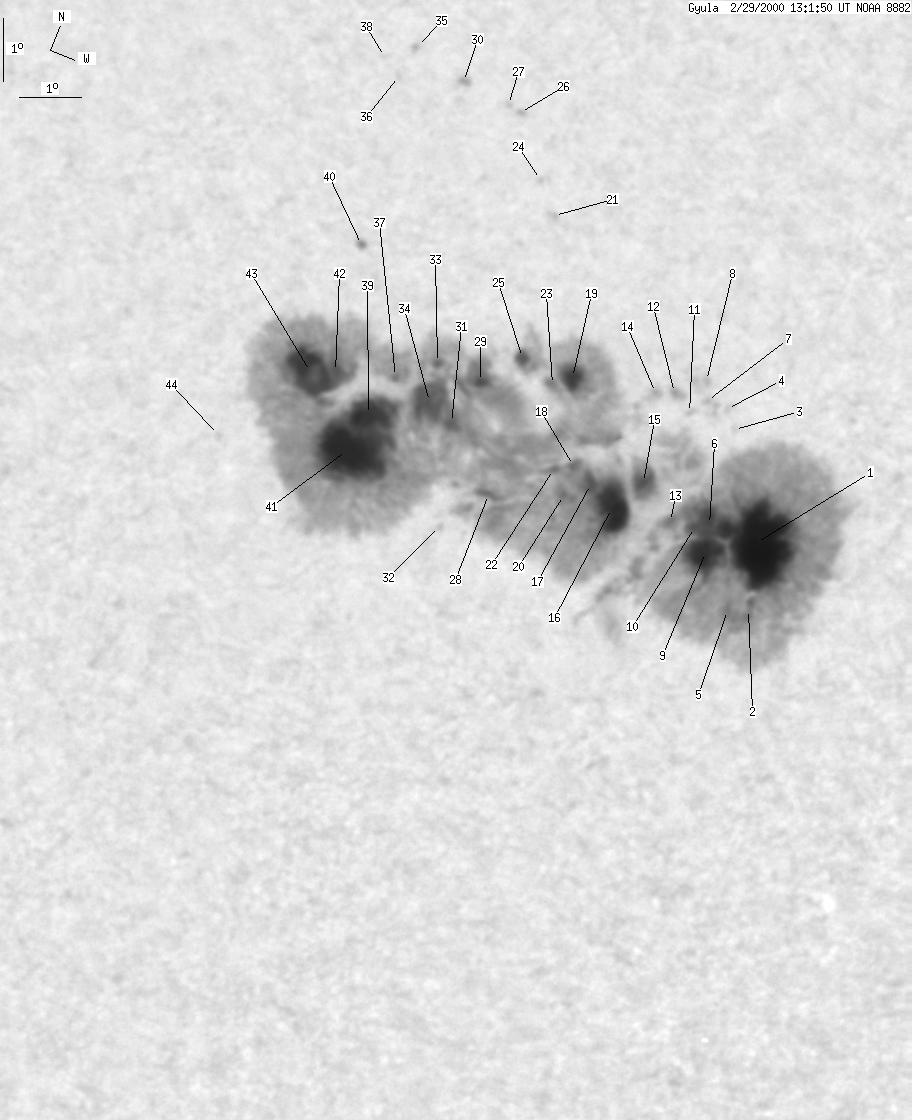
| group | Proj. U | Proj. WS | Corr. U | Corr. WS | B | L | LCM | Pos. angle | r |
| 326 | 2508 | 178 | 1391 | -16.25 | 329.88 | 25.90 | 247.75 | 0.4542 | |
|
previous
or next day for the same group /
back to the solar disc Gyula 2000-02-29 12:59:45 UT |
| spot | Proj. U | Proj. WS | Corr. U | Corr. WS | B | L | LCM | Pos. angle | r |
| 86 | 2473 | 49 | 1374 | -15.85 | 333.72 | 29.75 | 250.82 | 0.5074 | |
| 4 | -1 | 2 | -1 | -16.76 | 334.18 | 30.20 | 249.29 | 0.5171 | |
| 0 | 1 | 0 | 1 | -14.39 | 332.36 | 28.40 | 253.15 | 0.4833 | |
| 0 | 2 | 0 | 1 | -14.15 | 332.07 | 28.11 | 253.52 | 0.4784 | |
| 2 | -1 | 1 | -1 | -16.93 | 333.84 | 29.87 | 248.80 | 0.5131 | |
| 7 | -1 | 4 | -1 | -15.90 | 332.77 | 28.79 | 250.30 | 0.4940 | |
| 0 | 3 | 0 | 2 | -14.18 | 331.70 | 27.73 | 253.32 | 0.4730 | |
| 0 | 4 | 0 | 2 | -13.91 | 331.51 | 27.55 | 253.81 | 0.4695 | |
| 15 | -1 | 8 | -1 | -16.29 | 333.04 | 29.07 | 249.66 | 0.4994 | |
| 2 | -1 | 1 | -1 | -16.07 | 332.57 | 28.60 | 249.87 | 0.4919 | |
| 0 | 1 | 0 | 1 | -14.47 | 331.51 | 27.54 | 252.63 | 0.4710 | |
| 0 | 3 | 0 | 1 | -14.32 | 331.13 | 27.15 | 252.78 | 0.4649 | |
| 4 | -1 | 2 | -1 | -16.14 | 332.18 | 28.21 | 249.54 | 0.4866 | |
| 0 | 4 | 0 | 2 | -14.41 | 330.83 | 26.87 | 252.46 | 0.4610 | |
| 8 | -1 | 4 | -1 | -15.78 | 331.46 | 27.49 | 249.90 | 0.4750 | |
| 28 | -1 | 15 | -1 | -16.33 | 331.18 | 27.21 | 248.62 | 0.4731 | |
| 2 | -1 | 1 | -1 | -16.16 | 330.64 | 26.67 | 248.67 | 0.4647 | |
| 1 | -1 | 0 | -1 | -16.01 | 330.21 | 26.24 | 248.74 | 0.4579 | |
| 8 | -1 | 5 | -1 | -14.81 | 329.42 | 25.45 | 250.90 | 0.4415 | |
| 1 | -1 | 1 | -1 | -16.45 | 330.30 | 26.32 | 247.87 | 0.4610 | |
| 0 | 1 | 0 | 1 | -12.71 | 327.89 | 23.91 | 254.97 | 0.4112 | |
| 1 | -1 | 1 | -1 | -16.19 | 329.92 | 25.95 | 248.19 | 0.4545 | |
| 2 | -1 | 1 | -1 | -14.98 | 329.19 | 25.23 | 250.40 | 0.4390 | |
| 0 | 1 | 0 | 0 | -12.25 | 327.39 | 23.42 | 255.86 | 0.4023 | |
| 3 | -1 | 1 | -1 | -14.84 | 328.52 | 24.55 | 250.31 | 0.4283 | |
| 0 | 1 | 0 | 0 | -11.52 | 326.58 | 22.60 | 257.36 | 0.3876 | |
| 0 | 1 | 0 | 0 | -11.45 | 326.35 | 22.37 | 257.44 | 0.3839 | |
| 3 | -1 | 2 | -1 | -16.92 | 329.15 | 25.17 | 246.14 | 0.4468 | |
| 2 | -1 | 1 | -1 | -15.45 | 328.08 | 24.11 | 248.67 | 0.4245 | |
| 0 | 4 | 0 | 2 | -11.45 | 325.50 | 21.53 | 257.11 | 0.3706 | |
| 3 | -1 | 1 | -1 | -16.19 | 327.97 | 24.00 | 246.93 | 0.4264 | |
| 0 | 1 | 0 | 0 | -17.72 | 328.68 | 24.70 | 244.10 | 0.4444 | |
| 1 | -1 | 1 | -1 | -15.48 | 327.26 | 23.29 | 248.05 | 0.4126 | |
| 20 | -1 | 11 | -1 | -16.13 | 327.47 | 23.49 | 246.70 | 0.4188 | |
| 0 | 4 | 0 | 2 | -11.21 | 324.57 | 20.61 | 257.33 | 0.3554 | |
| 0 | 0 | 0 | 0 | -11.75 | 324.51 | 20.55 | 255.82 | 0.3560 | |
| 0 | -1 | 0 | -1 | -15.89 | 326.76 | 22.80 | 246.73 | 0.4074 | |
| 0 | 1 | 0 | 0 | -11.56 | 324.16 | 20.19 | 256.16 | 0.3499 | |
| 92 | -1 | 50 | -1 | -16.64 | 326.67 | 22.70 | 244.93 | 0.4099 | |
| 0 | 2 | 0 | 1 | -14.31 | 325.21 | 21.24 | 249.41 | 0.3766 | |
| -39 | -1 | -39 | -1 | -17.27 | 326.68 | 22.71 | 243.49 | 0.4138 | |
| 2 | -1 | 1 | -1 | -16.21 | 325.82 | 21.86 | 245.23 | 0.3955 | |
| 29 | -1 | 15 | -1 | -16.43 | 325.46 | 21.48 | 244.37 | 0.3913 | |
| 0 | 1 | 0 | 1 | -17.84 | 324.58 | 20.62 | 240.21 | 0.3880 | |
| Proj. U | - Projected umbra area in millionths of solar disc, negative values indicate | |
|
that the umbra consists of fragmented regions which cannot be separated without losing umbral area. In this way several spots (intensity minima in the umbra) have a common umbra, e.g. -2 means that the given spot shares an umbra with spot No.2, and the common U value is indicated at spot No.2. |
||
| Proj. WS | - Projected whole spot area in millionths of solar disc, negative values indicate | |
|
that several umbras have a common penumbra, e.g. -7 means that the given umbra shares a penumbra with umbra No.7, and the WS value is indicated at No.7. |
||
| Corr. U | - Corrected umbra area in millionths of solar hemisphere, for negative values see above | |
| Corr. WS | - Corrected whole spot area in millionths of solar hemisphere, for negative values see above | |
| B | - Heliographic latitude B; positive: North, negative: South | |
| L | - Heliographic longitude L | |
| LCM | - Longitudinal distance from the Sun's central meridian | |
| Pos. angle | - Position angle | |
| r | - Distance from the centre of Sun's disc in terms of Sun's radius | |