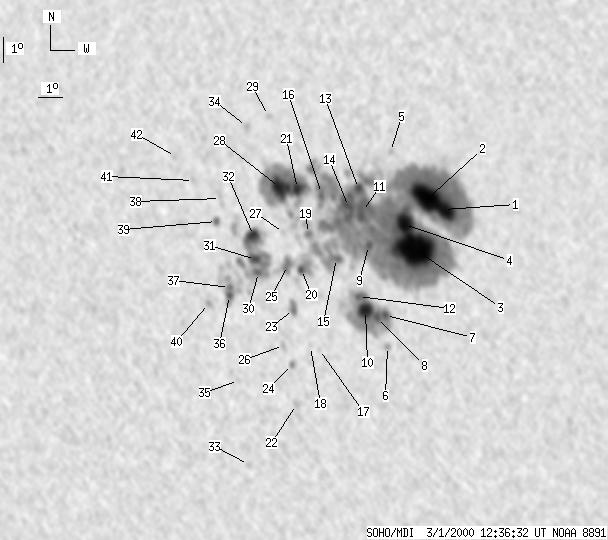
SOHO MDI 2000-03-01 12:36:32 UT
| group | Proj. U | Proj. WS | Corr. U | Corr. WS | B | L | LCM | Pos. angle | r |
| 436 | 3731 | 222 | 1910 | -15.27 | 278.42 | -12.39 | 125.07 | 0.2542 | |
|
previous
or next day for the same group /
back to the solar disc SOHO MDI 2000-03-01 12:36:32 UT |
| spot | Proj. U | Proj. WS | Corr. U | Corr. WS | B | L | LCM | Pos. angle | r |
| 94 | 3373 | 47 | 1724 | -14.43 | 281.12 | -9.69 | 128.04 | 0.2079 | |
| -1 | -1 | -1 | -1 | -13.99 | 280.49 | -10.31 | 124.65 | 0.2122 | |
| 134 | -1 | 68 | -1 | -15.96 | 279.86 | -10.94 | 130.24 | 0.2401 | |
| 23 | -1 | 12 | -1 | -14.98 | 279.51 | -11.30 | 126.02 | 0.2350 | |
| 0 | 5 | 0 | 2 | -12.13 | 279.08 | -11.72 | 114.01 | 0.2184 | |
| 0 | 6 | 0 | 3 | -19.73 | 278.50 | -12.31 | 137.59 | 0.2989 | |
| 7 | 240 | 4 | 124 | -18.51 | 278.51 | -12.30 | 134.54 | 0.2847 | |
| 6 | -7 | 3 | -7 | -18.58 | 278.17 | -12.64 | 133.98 | 0.2895 | |
| 8 | -1 | 4 | -1 | -15.76 | 277.99 | -12.81 | 125.41 | 0.2631 | |
| 20 | -7 | 10 | -7 | -18.29 | 277.69 | -13.12 | 132.21 | 0.2922 | |
| 19 | -1 | 10 | -1 | -14.43 | 277.83 | -12.98 | 120.65 | 0.2539 | |
| 4 | -7 | 2 | -7 | -17.74 | 277.44 | -13.36 | 130.20 | 0.2895 | |
| 7 | -1 | 4 | -1 | -13.53 | 277.72 | -13.09 | 117.25 | 0.2488 | |
| 26 | -1 | 13 | -1 | -14.22 | 277.27 | -13.54 | 118.95 | 0.2605 | |
| 5 | -1 | 3 | -1 | -16.23 | 276.64 | -14.16 | 124.33 | 0.2858 | |
| 7 | -1 | 4 | -1 | -13.68 | 276.20 | -14.61 | 115.47 | 0.2727 | |
| 0 | 5 | 0 | 3 | -19.77 | 275.63 | -15.18 | 131.98 | 0.3329 | |
| 0 | 7 | 0 | 4 | -19.64 | 275.26 | -15.55 | 131.03 | 0.3362 | |
| 3 | -1 | 1 | -1 | -15.22 | 275.56 | -15.25 | 119.51 | 0.2930 | |
| 5 | -1 | 2 | -1 | -16.61 | 275.15 | -15.65 | 123.00 | 0.3096 | |
| 15 | -1 | 8 | -1 | -13.46 | 275.23 | -15.58 | 113.47 | 0.2860 | |
| 0 | 8 | 0 | 4 | -21.92 | 274.41 | -16.40 | 134.65 | 0.3698 | |
| 4 | 17 | 2 | 9 | -18.16 | 274.68 | -16.13 | 126.43 | 0.3295 | |
| 0 | 7 | 0 | 4 | -20.33 | 274.42 | -16.39 | 131.22 | 0.3533 | |
| 6 | -1 | 3 | -1 | -16.43 | 274.58 | -16.22 | 121.65 | 0.3162 | |
| 0 | 7 | 0 | 4 | -19.56 | 274.11 | -16.69 | 128.98 | 0.3497 | |
| 0 | 2 | 0 | 1 | -15.14 | 274.52 | -16.28 | 117.85 | 0.3075 | |
| 22 | -1 | 11 | -1 | -13.39 | 274.49 | -16.32 | 112.41 | 0.2970 | |
| 0 | 5 | 0 | 2 | -10.60 | 274.21 | -16.59 | 102.90 | 0.2893 | |
| 1 | -1 | 1 | -1 | -16.67 | 273.34 | -17.46 | 120.59 | 0.3354 | |
| 6 | -1 | 3 | -1 | -16.15 | 273.27 | -17.54 | 119.11 | 0.3328 | |
| 8 | -1 | 4 | -1 | -15.22 | 273.27 | -17.54 | 116.50 | 0.3264 | |
| 0 | 5 | 0 | 3 | -24.24 | 271.98 | -18.82 | 135.47 | 0.4214 | |
| 0 | 6 | 0 | 3 | -10.99 | 273.29 | -17.52 | 103.64 | 0.3054 | |
| 0 | 2 | 0 | 1 | -20.87 | 272.02 | -18.79 | 128.87 | 0.3882 | |
| 2 | -1 | 1 | -1 | -17.52 | 272.03 | -18.78 | 121.13 | 0.3602 | |
| 1 | -1 | 1 | -1 | -17.20 | 272.06 | -18.74 | 120.39 | 0.3574 | |
| 0 | 13 | 0 | 7 | -13.73 | 272.01 | -18.80 | 110.99 | 0.3368 | |
| 3 | 8 | 1 | 4 | -14.61 | 271.76 | -19.04 | 113.24 | 0.3451 | |
| 0 | 6 | 0 | 3 | -17.79 | 271.10 | -19.71 | 120.71 | 0.3751 | |
| 0 | 4 | 0 | 2 | -12.99 | 270.94 | -19.87 | 108.06 | 0.3499 | |
| 0 | 5 | 0 | 3 | -12.03 | 270.26 | -20.55 | 104.98 | 0.3569 | |
| Proj. U | - Projected umbra area in millionths of solar disc, negative values indicate | |
|
that the umbra consists of fragmented regions which cannot be separated without losing umbral area. In this way several spots (intensity minima in the umbra) have a common umbra, e.g. -2 means that the given spot shares an umbra with spot No.2, and the common U value is indicated at spot No.2. |
||
| Proj. WS | - Projected whole spot area in millionths of solar disc, negative values indicate | |
|
that several umbras have a common penumbra, e.g. -7 means that the given umbra shares a penumbra with umbra No.7, and the WS value is indicated at No.7. |
||
| Corr. U | - Corrected umbra area in millionths of solar hemisphere, for negative values see above | |
| Corr. WS | - Corrected whole spot area in millionths of solar hemisphere, for negative values see above | |
| B | - Heliographic latitude B; positive: North, negative: South | |
| L | - Heliographic longitude L | |
| LCM | - Longitudinal distance from the Sun's central meridian | |
| Pos. angle | - Position angle | |
| r | - Distance from the centre of Sun's disc in terms of Sun's radius | |