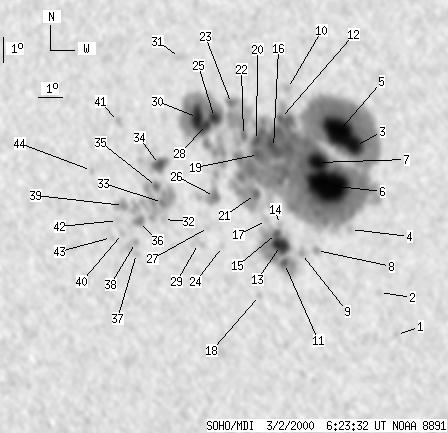
SOHO MDI 2000-03-02 06:23:32 UT
| group | Proj. U | Proj. WS | Corr. U | Corr. WS | B | L | LCM | Pos. angle | r |
| 411 | 3303 | 207 | 1657 | -15.33 | 278.09 | -2.95 | 161.95 | 0.1560 | |
|
previous
or next day for the same group /
back to the solar disc SOHO MDI 2000-03-02 06:23:32 UT |
| spot | Proj. U | Proj. WS | Corr. U | Corr. WS | B | L | LCM | Pos. angle | r |
| 0 | 3 | 0 | 2 | -21.96 | 282.56 | 1.52 | 185.53 | 0.2570 | |
| 0 | 11 | 0 | 6 | -20.30 | 281.85 | 0.81 | 183.34 | 0.2278 | |
| 28 | 2636 | 14 | 1319 | -14.54 | 280.87 | -0.17 | 178.69 | 0.1281 | |
| 0 | 6 | 0 | 3 | -17.82 | 280.66 | -0.38 | 178.05 | 0.1850 | |
| 75 | -3 | 37 | -3 | -13.99 | 280.19 | -0.85 | 173.07 | 0.1195 | |
| 119 | -3 | 60 | -3 | -16.09 | 279.78 | -1.26 | 172.23 | 0.1566 | |
| 27 | -3 | 14 | -3 | -15.20 | 279.35 | -1.69 | 168.42 | 0.1425 | |
| 0 | 7 | 0 | 4 | -18.64 | 279.28 | -1.76 | 171.63 | 0.2012 | |
| 0 | 8 | 0 | 4 | -18.75 | 278.66 | -2.37 | 168.91 | 0.2049 | |
| 0 | 7 | 0 | 4 | -12.32 | 278.19 | -2.85 | 151.38 | 0.1021 | |
| 6 | 168 | 3 | 85 | -19.14 | 277.96 | -3.07 | 166.24 | 0.2140 | |
| 5 | -3 | 3 | -3 | -13.48 | 277.89 | -3.15 | 153.99 | 0.1222 | |
| 23 | -11 | 12 | -11 | -18.43 | 277.82 | -3.22 | 164.68 | 0.2029 | |
| 0 | 5 | 0 | 2 | -17.61 | 277.79 | -3.25 | 163.35 | 0.1894 | |
| 6 | -11 | 3 | -11 | -17.96 | 277.66 | -3.38 | 163.29 | 0.1959 | |
| 19 | -3 | 10 | -3 | -14.60 | 277.60 | -3.44 | 155.74 | 0.1420 | |
| 0 | 9 | 0 | 5 | -17.45 | 277.27 | -3.77 | 160.57 | 0.1896 | |
| 0 | 5 | 0 | 3 | -20.40 | 276.91 | -4.13 | 163.54 | 0.2393 | |
| 7 | -3 | 3 | -3 | -14.87 | 277.00 | -4.04 | 152.96 | 0.1507 | |
| 8 | -3 | 4 | -3 | -14.33 | 276.93 | -4.11 | 150.76 | 0.1429 | |
| 6 | -3 | 3 | -3 | -16.43 | 276.84 | -4.20 | 156.38 | 0.1760 | |
| 5 | -3 | 3 | -3 | -14.13 | 276.41 | -4.63 | 147.06 | 0.1446 | |
| 2 | -3 | 1 | -3 | -12.88 | 275.96 | -5.08 | 138.99 | 0.1322 | |
| 0 | 6 | 0 | 3 | -18.45 | 275.45 | -5.59 | 154.70 | 0.2172 | |
| 12 | -3 | 6 | -3 | -13.42 | 275.27 | -5.77 | 138.03 | 0.1469 | |
| 6 | 58 | 3 | 29 | -16.49 | 275.19 | -5.85 | 148.86 | 0.1899 | |
| 0 | 5 | 0 | 2 | -17.70 | 274.91 | -6.13 | 150.87 | 0.2101 | |
| 7 | -3 | 3 | -3 | -13.68 | 274.95 | -6.09 | 137.71 | 0.1540 | |
| 0 | 16 | 0 | 8 | -18.32 | 274.48 | -6.56 | 150.71 | 0.2228 | |
| 24 | -3 | 12 | -3 | -13.41 | 274.59 | -6.45 | 134.86 | 0.1548 | |
| 0 | 8 | 0 | 4 | -11.08 | 273.94 | -7.10 | 119.39 | 0.1399 | |
| 0 | 7 | 0 | 3 | -17.36 | 273.09 | -7.95 | 143.32 | 0.2221 | |
| 4 | 192 | 2 | 97 | -16.69 | 273.07 | -7.97 | 141.33 | 0.2134 | |
| 10 | 96 | 5 | 49 | -15.21 | 273.01 | -8.03 | 136.15 | 0.1954 | |
| 6 | -33 | 3 | -33 | -16.06 | 272.86 | -8.18 | 138.59 | 0.2078 | |
| 3 | -33 | 2 | -33 | -17.42 | 272.10 | -8.94 | 140.32 | 0.2332 | |
| 0 | 4 | 0 | 2 | -18.67 | 271.91 | -9.12 | 143.11 | 0.2514 | |
| 0 | 14 | 0 | 7 | -18.24 | 271.90 | -9.14 | 141.95 | 0.2459 | |
| 3 | -33 | 1 | -33 | -16.78 | 271.48 | -9.56 | 136.56 | 0.2323 | |
| 0 | 5 | 0 | 2 | -17.88 | 271.38 | -9.66 | 139.47 | 0.2468 | |
| 0 | 9 | 0 | 4 | -13.51 | 271.43 | -9.61 | 124.45 | 0.1978 | |
| 0 | 10 | 0 | 5 | -17.36 | 271.21 | -9.83 | 137.51 | 0.2425 | |
| 0 | 3 | 0 | 2 | -18.02 | 270.92 | -10.12 | 138.59 | 0.2537 | |
| 0 | 5 | 0 | 3 | -15.39 | 270.25 | -10.79 | 128.65 | 0.2322 | |
| Proj. U | - Projected umbra area in millionths of solar disc, negative values indicate | |
|
that the umbra consists of fragmented regions which cannot be separated without losing umbral area. In this way several spots (intensity minima in the umbra) have a common umbra, e.g. -2 means that the given spot shares an umbra with spot No.2, and the common U value is indicated at spot No.2. |
||
| Proj. WS | - Projected whole spot area in millionths of solar disc, negative values indicate | |
|
that several umbras have a common penumbra, e.g. -7 means that the given umbra shares a penumbra with umbra No.7, and the WS value is indicated at No.7. |
||
| Corr. U | - Corrected umbra area in millionths of solar hemisphere, for negative values see above | |
| Corr. WS | - Corrected whole spot area in millionths of solar hemisphere, for negative values see above | |
| B | - Heliographic latitude B; positive: North, negative: South | |
| L | - Heliographic longitude L | |
| LCM | - Longitudinal distance from the Sun's central meridian | |
| Pos. angle | - Position angle | |
| r | - Distance from the centre of Sun's disc in terms of Sun's radius | |