Gyula 2000-03-09 09:51:17 UT
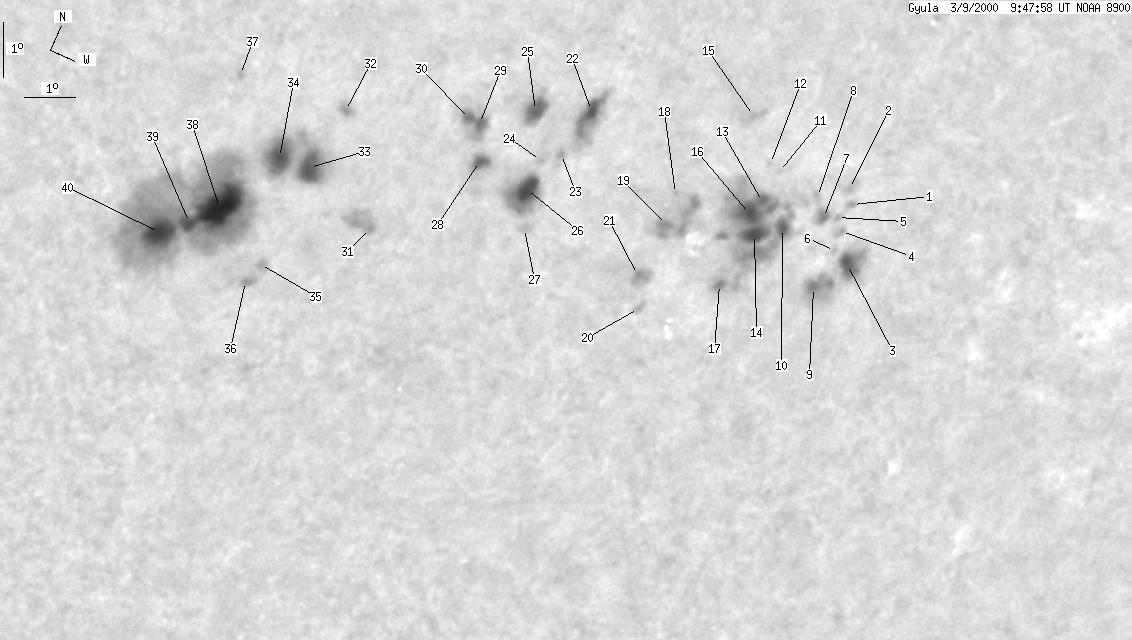
| group | Proj. U | Proj. WS | Corr. U | Corr. WS | B | L | LCM | Pos. angle | r |
| 91 | 640 | 58 | 436 | -16.10 | 230.11 | 42.97 | 253.79 | 0.6826 | |
|
previous
or next day for the same group /
back to the solar disc Gyula 2000-03-09 09:51:17 UT |
| spot | Proj. U | Proj. WS | Corr. U | Corr. WS | B | L | LCM | Pos. angle | r |
| 0 | 1 | 0 | 1 | -13.01 | 237.43 | 50.31 | 259.05 | 0.7659 | |
| 0 | 2 | 0 | 1 | -12.84 | 237.18 | 50.06 | 259.27 | 0.7631 | |
| 3 | 15 | 2 | 12 | -13.85 | 238.22 | 51.08 | 258.00 | 0.7746 | |
| 0 | 1 | 0 | 1 | -13.46 | 237.62 | 50.48 | 258.48 | 0.7680 | |
| 0 | 1 | 0 | 1 | -13.30 | 237.35 | 50.21 | 258.68 | 0.7650 | |
| 0 | 1 | 0 | 1 | -13.76 | 237.75 | 50.61 | 258.10 | 0.7695 | |
| 1 | 5 | 0 | 4 | -13.40 | 237.06 | 49.92 | 258.53 | 0.7618 | |
| 0 | 2 | 0 | 1 | -13.18 | 236.66 | 49.52 | 258.81 | 0.7573 | |
| 0 | 16 | 0 | 12 | -14.41 | 237.86 | 50.69 | 257.25 | 0.7707 | |
| 4 | 118 | 3 | 88 | -13.88 | 236.43 | 49.29 | 257.86 | 0.7550 | |
| 0 | 1 | 0 | 1 | -13.19 | 235.63 | 48.47 | 258.74 | 0.7454 | |
| 0 | 1 | 0 | 1 | -13.16 | 235.30 | 48.16 | 258.77 | 0.7419 | |
| 1 | -10 | 1 | -10 | -13.70 | 235.67 | 48.53 | 258.06 | 0.7464 | |
| 4 | -10 | 3 | -10 | -14.18 | 235.96 | 48.82 | 257.44 | 0.7499 | |
| 0 | 2 | 0 | 2 | -12.69 | 234.42 | 47.28 | 259.37 | 0.7316 | |
| 6 | -10 | 4 | -10 | -13.94 | 235.56 | 48.42 | 257.73 | 0.7453 | |
| 1 | -10 | 0 | -10 | -15.13 | 235.92 | 48.78 | 256.17 | 0.7501 | |
| 0 | 0 | 0 | 0 | -14.30 | 233.93 | 46.76 | 257.12 | 0.7265 | |
| 0 | 19 | 0 | 14 | -14.78 | 234.15 | 46.99 | 256.49 | 0.7295 | |
| 0 | 2 | 0 | 1 | -16.05 | 234.69 | 47.55 | 254.81 | 0.7371 | |
| 0 | 6 | 0 | 4 | -15.63 | 234.25 | 47.12 | 255.33 | 0.7318 | |
| 3 | 28 | 2 | 19 | -13.86 | 231.37 | 44.23 | 257.51 | 0.6960 | |
| 0 | 1 | 0 | 1 | -14.65 | 231.34 | 44.20 | 256.37 | 0.6964 | |
| 0 | 1 | 0 | 0 | -14.93 | 231.04 | 43.87 | 255.94 | 0.6927 | |
| 7 | 12 | 4 | 8 | -14.29 | 230.35 | 43.21 | 256.78 | 0.6839 | |
| 7 | 24 | 5 | 17 | -15.41 | 231.13 | 43.99 | 255.26 | 0.6947 | |
| 0 | 2 | 0 | 1 | -15.90 | 231.58 | 44.45 | 254.62 | 0.7008 | |
| 0 | 6 | 0 | 4 | -15.38 | 229.95 | 42.81 | 255.13 | 0.6803 | |
| 1 | 13 | 0 | 9 | -14.88 | 229.50 | 42.36 | 255.80 | 0.6741 | |
| 0 | -29 | 0 | -29 | -14.92 | 229.28 | 42.11 | 255.70 | 0.6710 | |
| 0 | 11 | 0 | 7 | -17.10 | 228.84 | 41.70 | 252.39 | 0.6694 | |
| 0 | 4 | 0 | 3 | -15.73 | 227.03 | 39.89 | 254.09 | 0.6443 | |
| 8 | 340 | 5 | 218 | -16.74 | 227.06 | 39.92 | 252.55 | 0.6465 | |
| 9 | -33 | 6 | -33 | -16.81 | 226.44 | 39.30 | 252.30 | 0.6387 | |
| 0 | 2 | 0 | 1 | -18.46 | 227.42 | 40.29 | 250.03 | 0.6550 | |
| 0 | 2 | 0 | 2 | -18.78 | 227.37 | 40.25 | 249.54 | 0.6553 | |
| 0 | 1 | 0 | 1 | -16.04 | 224.89 | 37.75 | 253.13 | 0.6171 | |
| 22 | -33 | 14 | -33 | -17.97 | 226.00 | 38.86 | 250.37 | 0.6359 | |
| 3 | -33 | 2 | -33 | -18.39 | 225.68 | 38.54 | 249.63 | 0.6330 | |
| 11 | -33 | 7 | -33 | -18.74 | 225.34 | 38.20 | 248.98 | 0.6296 | |
| Proj. U | - Projected umbra area in millionths of solar disc, negative values indicate | |
|
that the umbra consists of fragmented regions which cannot be separated without losing umbral area. In this way several spots (intensity minima in the umbra) have a common umbra, e.g. -2 means that the given spot shares an umbra with spot No.2, and the common U value is indicated at spot No.2. |
||
| Proj. WS | - Projected whole spot area in millionths of solar disc, negative values indicate | |
|
that several umbras have a common penumbra, e.g. -7 means that the given umbra shares a penumbra with umbra No.7, and the WS value is indicated at No.7. |
||
| Corr. U | - Corrected umbra area in millionths of solar hemisphere, for negative values see above | |
| Corr. WS | - Corrected whole spot area in millionths of solar hemisphere, for negative values see above | |
| B | - Heliographic latitude B; positive: North, negative: South | |
| L | - Heliographic longitude L | |
| LCM | - Longitudinal distance from the Sun's central meridian | |
| Pos. angle | - Position angle | |
| r | - Distance from the centre of Sun's disc in terms of Sun's radius | |