Gyula 2000-03-10 12:02:11 UT
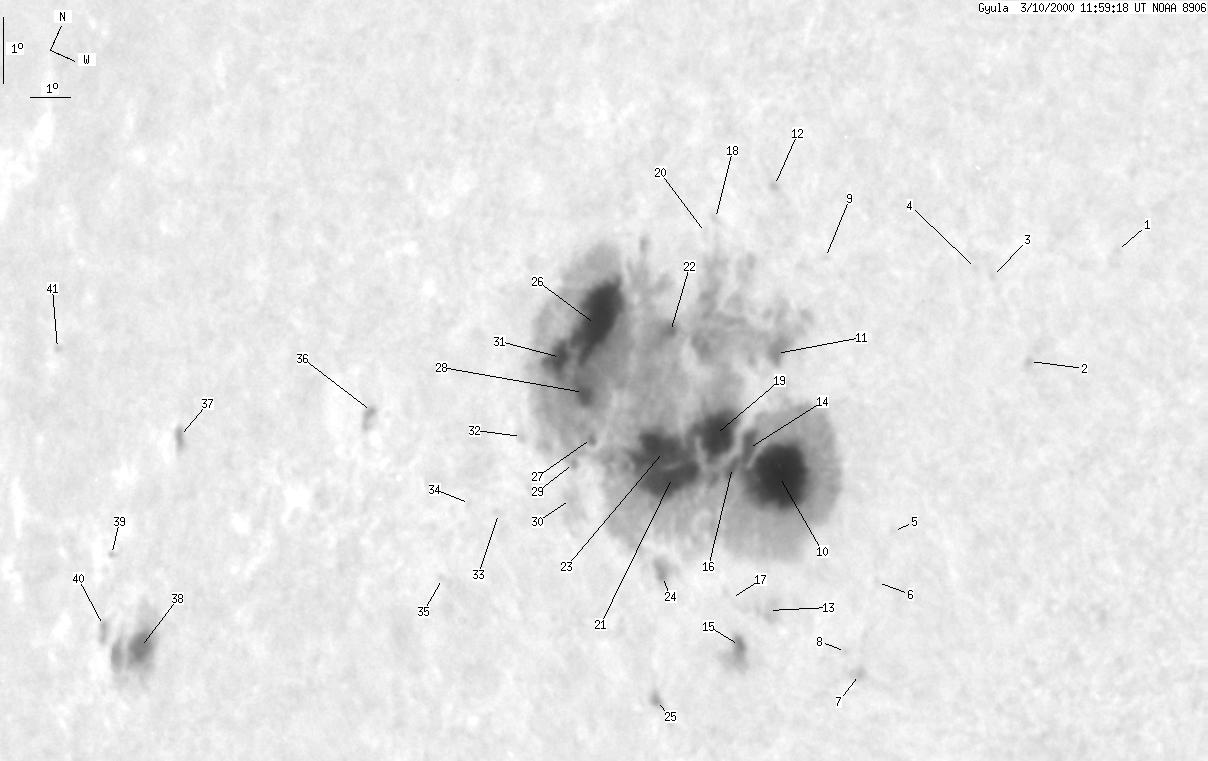
| group | Proj. U | Proj. WS | Corr. U | Corr. WS | B | L | LCM | Pos. angle | r |
| 225 | 1753 | 175 | 1365 | -16.44 | 121.95 | -50.82 | 105.41 | 0.7716 | |
|
previous
or next day for the same group /
back to the solar disc Gyula 2000-03-10 12:02:11 UT |
| spot | Proj. U | Proj. WS | Corr. U | Corr. WS | B | L | LCM | Pos. angle | r |
| 0 | 1 | 0 | 1 | -11.71 | 131.37 | -41.42 | 99.56 | 0.6592 | |
| 0 | 2 | 0 | 1 | -13.77 | 130.21 | -42.58 | 102.54 | 0.6756 | |
| 0 | 1 | 0 | 0 | -12.65 | 128.99 | -43.80 | 100.78 | 0.6898 | |
| 0 | 1 | 0 | 1 | -12.61 | 128.59 | -44.20 | 100.70 | 0.6947 | |
| 0 | 1 | 0 | 1 | -16.79 | 128.19 | -44.60 | 106.64 | 0.7039 | |
| 0 | 2 | 0 | 1 | -17.61 | 128.07 | -44.72 | 107.77 | 0.7066 | |
| 0 | 4 | 0 | 3 | -19.04 | 128.02 | -44.75 | 109.77 | 0.7095 | |
| 0 | 2 | 0 | 1 | -18.75 | 127.63 | -45.13 | 109.29 | 0.7133 | |
| 0 | 1 | 0 | 1 | -13.09 | 125.31 | -47.48 | 101.18 | 0.7341 | |
| 55 | 1601 | 40 | 1227 | -16.56 | 125.42 | -47.34 | 105.92 | 0.7354 | |
| 2 | -10 | 1 | -10 | -14.69 | 124.72 | -48.07 | 103.31 | 0.7418 | |
| 0 | 2 | 0 | 1 | -12.33 | 123.69 | -49.07 | 100.08 | 0.7520 | |
| 0 | 8 | 0 | 6 | -18.54 | 125.76 | -47.01 | 108.66 | 0.7343 | |
| 4 | -10 | 3 | -10 | -16.21 | 124.63 | -48.13 | 105.35 | 0.7439 | |
| 2 | 17 | 2 | 12 | -19.16 | 125.21 | -47.55 | 109.40 | 0.7413 | |
| 3 | -10 | 2 | -10 | -16.63 | 124.33 | -48.44 | 105.88 | 0.7477 | |
| 0 | 4 | 0 | 3 | -18.47 | 124.83 | -47.96 | 108.40 | 0.7447 | |
| 0 | 3 | 0 | 2 | -12.97 | 122.58 | -50.21 | 100.89 | 0.7649 | |
| 28 | -10 | 21 | -10 | -16.17 | 123.70 | -49.06 | 105.20 | 0.7541 | |
| 0 | 1 | 0 | 0 | -13.29 | 122.48 | -50.31 | 101.31 | 0.7661 | |
| 50 | -10 | 39 | -10 | -16.97 | 122.88 | -49.91 | 106.16 | 0.7642 | |
| 1 | -10 | 1 | -10 | -14.82 | 122.12 | -50.64 | 103.30 | 0.7704 | |
| -21 | -10 | -21 | -10 | -16.71 | 122.54 | -50.22 | 105.79 | 0.7672 | |
| 0 | 9 | 0 | 7 | -18.45 | 123.08 | -49.71 | 108.12 | 0.7637 | |
| 0 | 4 | 0 | 3 | -20.37 | 123.37 | -49.39 | 110.68 | 0.7630 | |
| 53 | -10 | 43 | -10 | -15.03 | 120.29 | -52.48 | 103.46 | 0.7899 | |
| 2 | -10 | 1 | -10 | -16.75 | 120.73 | -52.06 | 105.66 | 0.7866 | |
| 7 | -10 | 5 | -10 | -16.08 | 120.28 | -52.48 | 104.78 | 0.7905 | |
| 1 | -10 | 1 | -10 | -17.11 | 120.39 | -52.40 | 106.10 | 0.7904 | |
| 0 | 14 | 0 | 11 | -17.71 | 120.44 | -52.35 | 106.86 | 0.7904 | |
| 8 | -10 | 6 | -10 | -15.68 | 119.60 | -53.16 | 104.24 | 0.7973 | |
| 0 | 2 | 0 | 2 | -16.98 | 118.93 | -53.86 | 105.81 | 0.8050 | |
| 0 | 2 | 0 | 2 | -18.13 | 118.66 | -54.13 | 107.22 | 0.8085 | |
| 0 | 1 | 0 | 1 | -18.09 | 117.83 | -54.96 | 107.09 | 0.8164 | |
| 0 | 1 | 0 | 1 | -19.31 | 117.39 | -55.37 | 108.56 | 0.8213 | |
| 0 | 5 | 0 | 5 | -17.15 | 114.59 | -58.17 | 105.76 | 0.8457 | |
| 0 | 4 | 0 | 5 | -17.98 | 108.62 | -64.17 | 106.53 | 0.8949 | |
| 9 | 54 | 10 | 61 | -21.24 | 108.02 | -64.76 | 110.15 | 0.8999 | |
| 0 | 1 | 0 | 1 | -19.91 | 106.61 | -66.18 | 108.63 | 0.9095 | |
| 0 | 4 | 0 | 4 | -20.99 | 106.55 | -66.24 | 109.82 | 0.9101 | |
| 0 | 1 | 0 | 1 | -16.90 | 103.44 | -69.35 | 105.36 | 0.9301 | |
| Proj. U | - Projected umbra area in millionths of solar disc, negative values indicate | |
|
that the umbra consists of fragmented regions which cannot be separated without losing umbral area. In this way several spots (intensity minima in the umbra) have a common umbra, e.g. -2 means that the given spot shares an umbra with spot No.2, and the common U value is indicated at spot No.2. |
||
| Proj. WS | - Projected whole spot area in millionths of solar disc, negative values indicate | |
|
that several umbras have a common penumbra, e.g. -7 means that the given umbra shares a penumbra with umbra No.7, and the WS value is indicated at No.7. |
||
| Corr. U | - Corrected umbra area in millionths of solar hemisphere, for negative values see above | |
| Corr. WS | - Corrected whole spot area in millionths of solar hemisphere, for negative values see above | |
| B | - Heliographic latitude B; positive: North, negative: South | |
| L | - Heliographic longitude L | |
| LCM | - Longitudinal distance from the Sun's central meridian | |
| Pos. angle | - Position angle | |
| r | - Distance from the centre of Sun's disc in terms of Sun's radius | |