Gyula 2000-03-12 07:25:22 UT
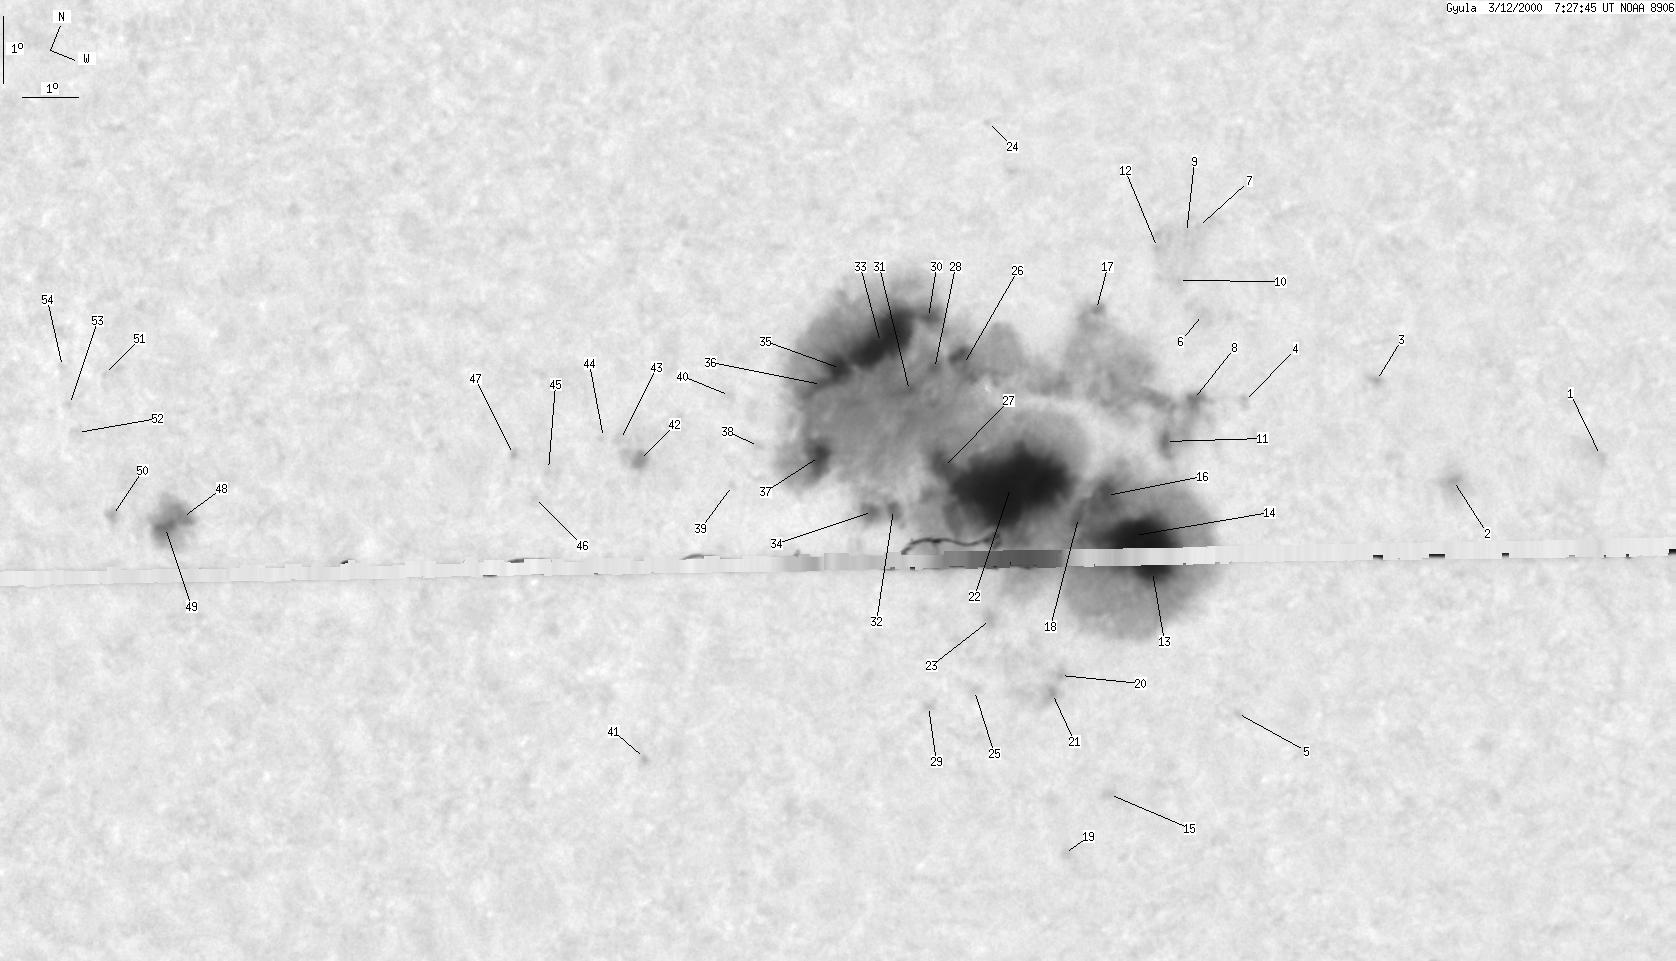
| group | Proj. U | Proj. WS | Corr. U | Corr. WS | B | L | LCM | Pos. angle | r |
| 312 | 2545 | 175 | 1420 | -16.28 | 122.84 | -26.08 | 112.07 | 0.4564 | |
|
previous
or next day for the same group /
back to the solar disc Gyula 2000-03-12 07:25:22 UT |
| spot | Proj. U | Proj. WS | Corr. U | Corr. WS | B | L | LCM | Pos. angle | r |
| 0 | 1 | 0 | 1 | -12.85 | 132.78 | -16.14 | 110.85 | 0.2913 | |
| 0 | 18 | 0 | 10 | -14.01 | 130.65 | -18.27 | 112.27 | 0.3302 | |
| 0 | 1 | 0 | 1 | -12.99 | 128.91 | -20.00 | 107.99 | 0.3520 | |
| 0 | 2 | 0 | 1 | -13.99 | 126.93 | -21.99 | 109.27 | 0.3865 | |
| 0 | 1 | 0 | 1 | -18.51 | 128.38 | -20.53 | 121.48 | 0.3917 | |
| 0 | 3 | 0 | 1 | -12.97 | 125.81 | -23.11 | 106.07 | 0.3998 | |
| 0 | 1 | 0 | 0 | -11.73 | 125.28 | -23.64 | 102.80 | 0.4044 | |
| 1 | 2419 | 0 | 1342 | -14.23 | 126.10 | -22.82 | 109.32 | 0.4001 | |
| 0 | 1 | 0 | 1 | -11.88 | 125.12 | -23.80 | 103.10 | 0.4072 | |
| 0 | 3 | 0 | 2 | -12.61 | 125.24 | -23.68 | 104.92 | 0.4073 | |
| 2 | -8 | 1 | -8 | -14.98 | 125.86 | -23.06 | 110.96 | 0.4069 | |
| 0 | 8 | 0 | 4 | -12.24 | 124.73 | -24.19 | 103.83 | 0.4142 | |
| 10 | -8 | 6 | -8 | -16.92 | 126.29 | -22.62 | 115.80 | 0.4105 | |
| 47 | -8 | 26 | -8 | -16.49 | 125.82 | -23.10 | 114.45 | 0.4150 | |
| 0 | 2 | 0 | 1 | -20.38 | 126.64 | -22.28 | 123.66 | 0.4288 | |
| 5 | -8 | 3 | -8 | -16.06 | 125.16 | -23.76 | 112.99 | 0.4223 | |
| 2 | -8 | 1 | -8 | -13.45 | 124.06 | -24.86 | 106.36 | 0.4279 | |
| 3 | -8 | 2 | -8 | -16.53 | 124.80 | -24.11 | 113.77 | 0.4298 | |
| 0 | 1 | 0 | 1 | -21.48 | 126.14 | -22.78 | 125.37 | 0.4436 | |
| 0 | 3 | 0 | 2 | -18.91 | 125.26 | -23.66 | 119.27 | 0.4371 | |
| 0 | 6 | 0 | 3 | -19.21 | 125.21 | -23.71 | 119.86 | 0.4397 | |
| 140 | -8 | 77 | -8 | -16.45 | 123.52 | -25.40 | 112.72 | 0.4478 | |
| 0 | 3 | 0 | 1 | -18.46 | 123.81 | -25.11 | 117.15 | 0.4543 | |
| 0 | 1 | 0 | 0 | -11.32 | 121.28 | -27.64 | 100.68 | 0.4648 | |
| 0 | 2 | 0 | 1 | -19.58 | 123.86 | -25.06 | 119.46 | 0.4602 | |
| 8 | -8 | 5 | -8 | -14.92 | 122.13 | -26.79 | 108.67 | 0.4617 | |
| 9 | -8 | 5 | -8 | -16.50 | 122.29 | -26.63 | 112.08 | 0.4657 | |
| 2 | -8 | 1 | -8 | -15.07 | 121.75 | -27.18 | 108.80 | 0.4680 | |
| 0 | 1 | 0 | 1 | -20.05 | 123.13 | -25.78 | 119.80 | 0.4728 | |
| 3 | -8 | 2 | -8 | -14.42 | 121.30 | -27.62 | 107.25 | 0.4720 | |
| 1 | -8 | 0 | -8 | -15.57 | 121.34 | -27.58 | 109.63 | 0.4755 | |
| 2 | -8 | 1 | -8 | -17.37 | 121.63 | -27.29 | 113.44 | 0.4789 | |
| 55 | -8 | 31 | -8 | -15.02 | 120.61 | -28.31 | 108.18 | 0.4841 | |
| 2 | -8 | 1 | -8 | -17.50 | 121.28 | -27.64 | 113.50 | 0.4845 | |
| -33 | -8 | -33 | -8 | -15.60 | 120.04 | -28.87 | 109.09 | 0.4942 | |
| 4 | -8 | 2 | -8 | -15.92 | 119.79 | -29.13 | 109.61 | 0.4989 | |
| 8 | -8 | 5 | -8 | -16.97 | 120.10 | -28.82 | 111.81 | 0.4987 | |
| 0 | 1 | 0 | 1 | -17.14 | 118.97 | -29.94 | 111.56 | 0.5149 | |
| 0 | 1 | 0 | 1 | -17.83 | 118.69 | -30.23 | 112.71 | 0.5217 | |
| 0 | 1 | 0 | 1 | -16.54 | 118.22 | -30.70 | 110.09 | 0.5232 | |
| 0 | 1 | 0 | 1 | -22.27 | 118.22 | -30.70 | 120.31 | 0.5494 | |
| 1 | 10 | 1 | 6 | -17.93 | 116.89 | -32.03 | 112.03 | 0.5465 | |
| 0 | 2 | 0 | 1 | -17.71 | 116.45 | -32.47 | 111.46 | 0.5516 | |
| 0 | 2 | 0 | 1 | -17.77 | 116.13 | -32.79 | 111.42 | 0.5562 | |
| 0 | 2 | 0 | 1 | -18.50 | 115.24 | -33.67 | 112.32 | 0.5706 | |
| 0 | 0 | 0 | 0 | -18.99 | 115.10 | -33.82 | 113.09 | 0.5743 | |
| 0 | 1 | 0 | 1 | -18.45 | 114.52 | -34.40 | 111.94 | 0.5800 | |
| 3 | 41 | 2 | 27 | -20.92 | 108.13 | -40.79 | 113.52 | 0.6678 | |
| 4 | -48 | 3 | -48 | -21.15 | 107.80 | -41.11 | 113.75 | 0.6723 | |
| 0 | 2 | 0 | 2 | -21.21 | 106.62 | -42.30 | 113.47 | 0.6864 | |
| 0 | 0 | 0 | 0 | -19.16 | 105.93 | -42.99 | 110.35 | 0.6893 | |
| 0 | 3 | 0 | 2 | -20.13 | 105.56 | -43.36 | 111.65 | 0.6959 | |
| 0 | 0 | 0 | 0 | -19.75 | 105.28 | -43.64 | 111.04 | 0.6982 | |
| 0 | 1 | 0 | 1 | -19.22 | 104.98 | -43.93 | 110.22 | 0.7005 | |
| Proj. U | - Projected umbra area in millionths of solar disc, negative values indicate | |
|
that the umbra consists of fragmented regions which cannot be separated without losing umbral area. In this way several spots (intensity minima in the umbra) have a common umbra, e.g. -2 means that the given spot shares an umbra with spot No.2, and the common U value is indicated at spot No.2. |
||
| Proj. WS | - Projected whole spot area in millionths of solar disc, negative values indicate | |
|
that several umbras have a common penumbra, e.g. -7 means that the given umbra shares a penumbra with umbra No.7, and the WS value is indicated at No.7. |
||
| Corr. U | - Corrected umbra area in millionths of solar hemisphere, for negative values see above | |
| Corr. WS | - Corrected whole spot area in millionths of solar hemisphere, for negative values see above | |
| B | - Heliographic latitude B; positive: North, negative: South | |
| L | - Heliographic longitude L | |
| LCM | - Longitudinal distance from the Sun's central meridian | |
| Pos. angle | - Position angle | |
| r | - Distance from the centre of Sun's disc in terms of Sun's radius | |