Kanzelhoehe 2000-03-15 10:01:35 UT
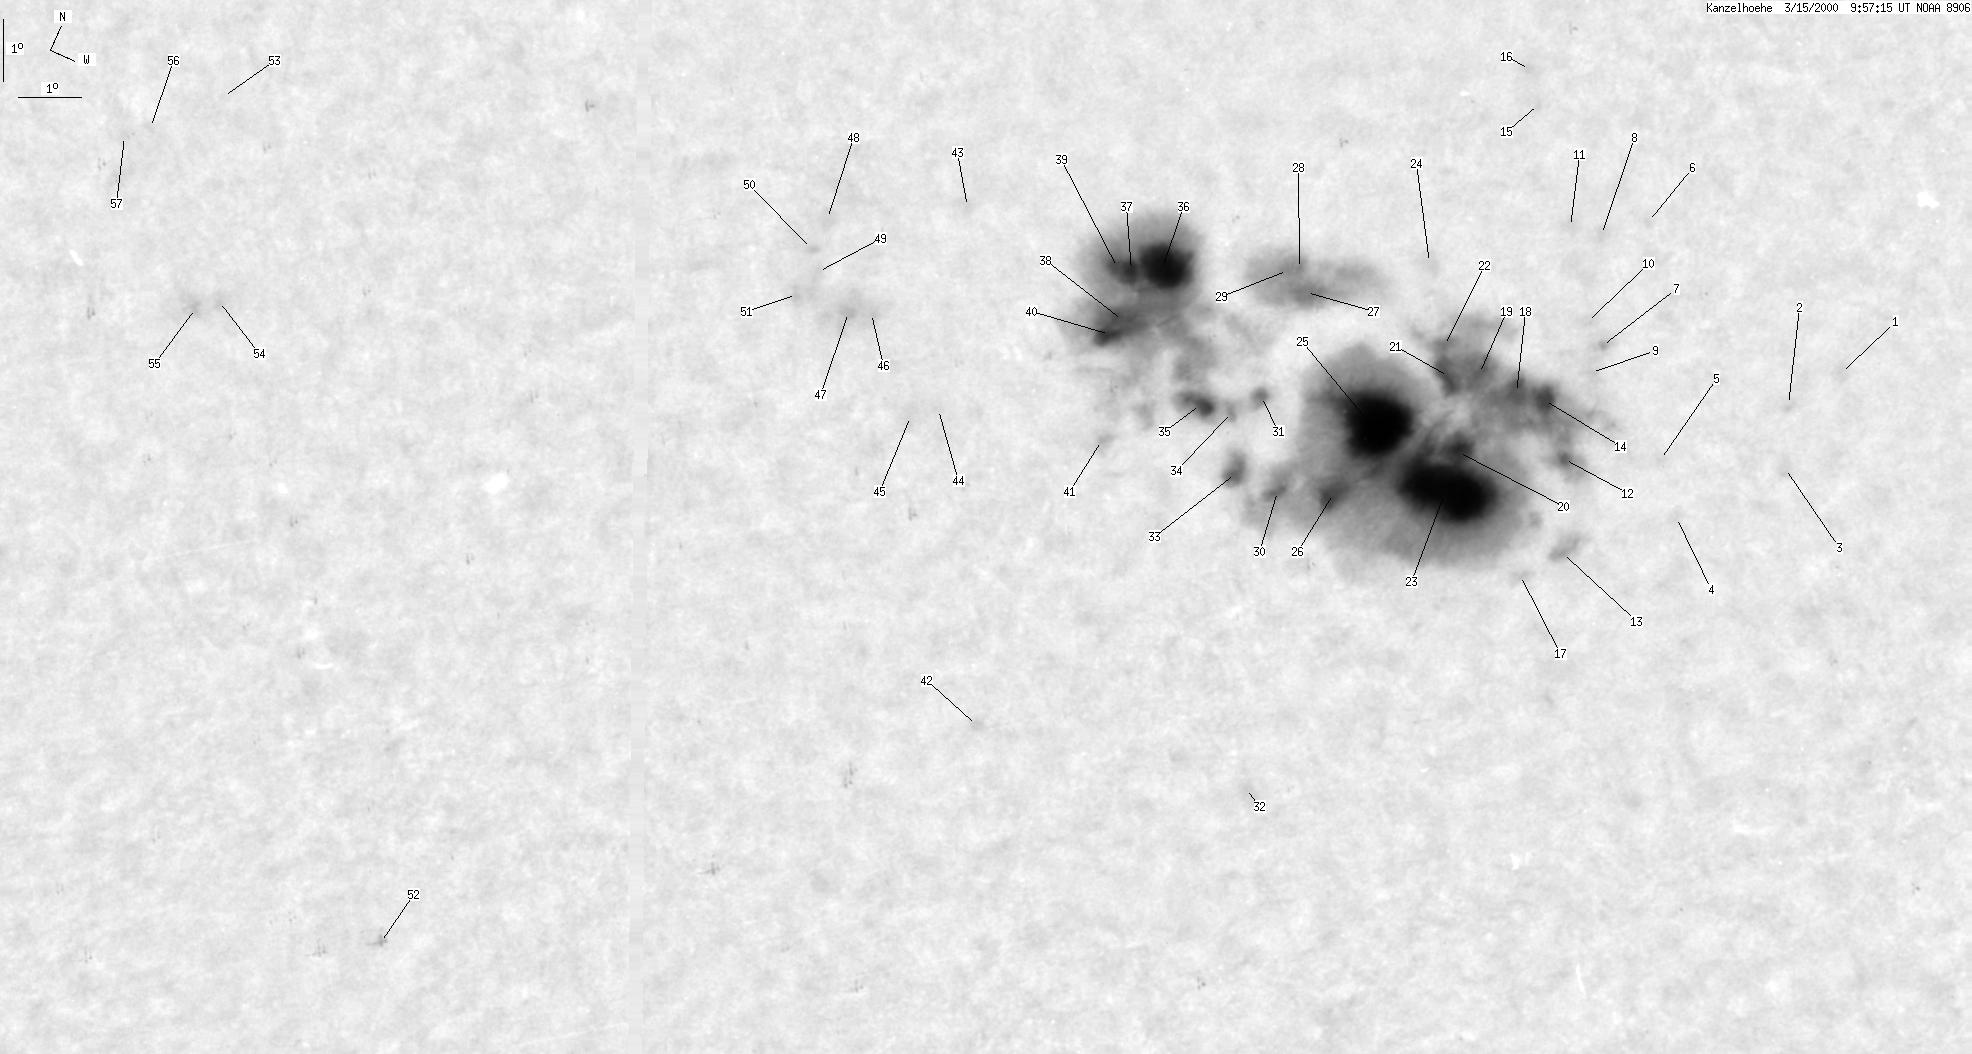
| group | Proj. U | Proj. WS | Corr. U | Corr. WS | B | L | LCM | Pos. angle | r |
| 368 | 2464 | 192 | 1283 | -16.02 | 123.61 | 15.64 | 237.90 | 0.3070 | |
|
previous
or next day for the same group /
back to the solar disc Kanzelhoehe 2000-03-15 10:01:35 UT |
| spot | Proj. U | Proj. WS | Corr. U | Corr. WS | B | L | LCM | Pos. angle | r |
| 0 | 6 | 0 | 3 | -12.21 | 131.12 | 23.11 | 255.68 | 0.3977 | |
| 0 | 5 | 0 | 3 | -13.03 | 130.60 | 22.59 | 253.37 | 0.3922 | |
| 0 | 4 | 0 | 2 | -13.94 | 131.10 | 23.09 | 251.44 | 0.4033 | |
| 0 | 1 | 0 | 1 | -15.40 | 129.89 | 21.88 | 247.06 | 0.3919 | |
| 0 | 2 | 0 | 1 | -14.71 | 129.15 | 21.14 | 248.19 | 0.3774 | |
| 0 | 2 | 0 | 1 | -11.50 | 127.02 | 19.01 | 255.52 | 0.3312 | |
| 0 | 4 | 0 | 2 | -13.54 | 127.34 | 19.33 | 249.85 | 0.3443 | |
| 0 | 3 | 0 | 2 | -12.01 | 126.43 | 18.42 | 253.61 | 0.3236 | |
| 0 | 1 | 0 | 1 | -13.99 | 127.40 | 19.39 | 248.64 | 0.3474 | |
| 0 | 4 | 0 | 2 | -13.31 | 126.92 | 18.91 | 250.15 | 0.3368 | |
| 0 | 4 | 0 | 2 | -12.12 | 125.92 | 17.91 | 252.91 | 0.3159 | |
| 3 | 1457 | 1 | 765 | -15.39 | 127.73 | 19.72 | 245.19 | 0.3599 | |
| 0 | 15 | 0 | 8 | -16.66 | 128.47 | 20.50 | 242.75 | 0.3790 | |
| 8 | -12 | 4 | -12 | -14.69 | 126.92 | 18.95 | 246.32 | 0.3445 | |
| 0 | 2 | 0 | 1 | -10.65 | 124.51 | 16.50 | 256.70 | 0.2880 | |
| 0 | 5 | 0 | 3 | -10.22 | 124.11 | 16.10 | 257.93 | 0.2803 | |
| 0 | 4 | 0 | 2 | -17.33 | 128.07 | 20.06 | 240.69 | 0.3772 | |
| 8 | -12 | 4 | -12 | -14.74 | 126.44 | 18.47 | 245.70 | 0.3376 | |
| 3 | -12 | 2 | -12 | -14.71 | 125.69 | 17.72 | 245.00 | 0.3263 | |
| 135 | -12 | 71 | -12 | -16.02 | 126.05 | 18.08 | 241.77 | 0.3400 | |
| 14 | -12 | 7 | -12 | -14.99 | 125.25 | 17.28 | 243.71 | 0.3215 | |
| 4 | -12 | 2 | -12 | -14.65 | 125.02 | 17.01 | 244.36 | 0.3152 | |
| -20 | -12 | -20 | -12 | -16.68 | 126.14 | 18.17 | 240.14 | 0.3459 | |
| 0 | 7 | 0 | 4 | -13.60 | 124.14 | 16.13 | 246.56 | 0.2956 | |
| 97 | -12 | 51 | -12 | -16.26 | 124.59 | 16.62 | 239.25 | 0.3210 | |
| 12 | -12 | 6 | -12 | -17.42 | 124.58 | 16.61 | 236.10 | 0.3300 | |
| 9 | 153 | 5 | 79 | -14.88 | 122.52 | 14.55 | 240.33 | 0.2807 | |
| 1 | -27 | 1 | -27 | -14.59 | 122.29 | 14.28 | 240.85 | 0.2745 | |
| 2 | -27 | 1 | -27 | -14.70 | 122.13 | 14.12 | 240.23 | 0.2730 | |
| 2 | -12 | 1 | -12 | -17.87 | 123.75 | 15.74 | 233.60 | 0.3223 | |
| 2 | 731 | 1 | 375 | -16.63 | 122.71 | 14.74 | 235.33 | 0.2977 | |
| 0 | 0 | 0 | 0 | -22.31 | 125.88 | 17.87 | 226.77 | 0.3914 | |
| 5 | -12 | 3 | -12 | -17.84 | 122.92 | 14.95 | 232.34 | 0.3115 | |
| 1 | -31 | 0 | -31 | -17.08 | 122.43 | 14.42 | 233.50 | 0.2975 | |
| 6 | -31 | 3 | -31 | -17.15 | 121.86 | 13.89 | 232.33 | 0.2910 | |
| 39 | -31 | 20 | -31 | -15.49 | 120.27 | 12.30 | 234.27 | 0.2541 | |
| 6 | -31 | 3 | -31 | -15.70 | 119.82 | 11.85 | 232.60 | 0.2500 | |
| 6 | -31 | 3 | -31 | -16.47 | 120.03 | 12.06 | 230.61 | 0.2604 | |
| 2 | -31 | 1 | -31 | -15.82 | 119.63 | 11.62 | 231.66 | 0.2482 | |
| 3 | -31 | 2 | -31 | -16.75 | 120.01 | 12.04 | 229.70 | 0.2631 | |
| 0 | 6 | 0 | 3 | -18.38 | 120.75 | 12.74 | 226.64 | 0.2891 | |
| 0 | 3 | 0 | 1 | -23.33 | 121.26 | 13.25 | 216.76 | 0.3532 | |
| 0 | 2 | 0 | 1 | -15.99 | 116.99 | 8.98 | 224.06 | 0.2167 | |
| 0 | 2 | 0 | 1 | -19.06 | 118.11 | 10.09 | 218.51 | 0.2673 | |
| 0 | 4 | 0 | 2 | -19.36 | 117.75 | 9.74 | 216.83 | 0.2674 | |
| 0 | 3 | 0 | 1 | -18.15 | 116.39 | 8.38 | 215.78 | 0.2379 | |
| 0 | 4 | 0 | 2 | -18.32 | 115.98 | 8.01 | 214.19 | 0.2365 | |
| 0 | 8 | 0 | 4 | -17.10 | 115.04 | 7.03 | 213.96 | 0.2103 | |
| 0 | 1 | 0 | 0 | -17.92 | 115.30 | 7.29 | 212.74 | 0.2242 | |
| 0 | 4 | 0 | 2 | -17.64 | 115.03 | 7.01 | 212.48 | 0.2177 | |
| 0 | 3 | 0 | 2 | -18.39 | 115.14 | 7.13 | 211.04 | 0.2296 | |
| 0 | 2 | 0 | 1 | -30.82 | 113.90 | 5.89 | 192.38 | 0.4132 | |
| 0 | 1 | 0 | 0 | -19.35 | 105.26 | -2.75 | 167.92 | 0.2171 | |
| 0 | 4 | 0 | 2 | -22.35 | 106.57 | -1.44 | 174.93 | 0.2644 | |
| 0 | 2 | 0 | 1 | -22.61 | 106.25 | -1.76 | 173.93 | 0.2694 | |
| 0 | 2 | 0 | 1 | -20.27 | 104.36 | -3.65 | 165.27 | 0.2359 | |
| 0 | 3 | 0 | 2 | -20.57 | 104.02 | -3.99 | 164.34 | 0.2423 | |
| Proj. U | - Projected umbra area in millionths of solar disc, negative values indicate | |
|
that the umbra consists of fragmented regions which cannot be separated without losing umbral area. In this way several spots (intensity minima in the umbra) have a common umbra, e.g. -2 means that the given spot shares an umbra with spot No.2, and the common U value is indicated at spot No.2. |
||
| Proj. WS | - Projected whole spot area in millionths of solar disc, negative values indicate | |
|
that several umbras have a common penumbra, e.g. -7 means that the given umbra shares a penumbra with umbra No.7, and the WS value is indicated at No.7. |
||
| Corr. U | - Corrected umbra area in millionths of solar hemisphere, for negative values see above | |
| Corr. WS | - Corrected whole spot area in millionths of solar hemisphere, for negative values see above | |
| B | - Heliographic latitude B; positive: North, negative: South | |
| L | - Heliographic longitude L | |
| LCM | - Longitudinal distance from the Sun's central meridian | |
| Pos. angle | - Position angle | |
| r | - Distance from the centre of Sun's disc in terms of Sun's radius | |