Gyula 2000-03-19 07:58:11 UT
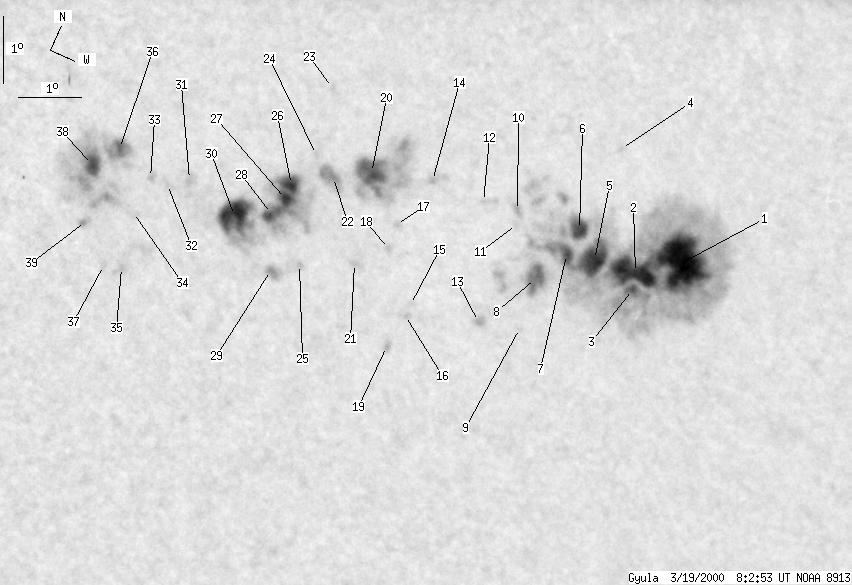
| group | Proj. U | Proj. WS | Corr. U | Corr. WS | B | L | LCM | Pos. angle | r |
| 121 | 842 | 61 | 429 | -15.80 | 46.22 | -10.15 | 133.54 | 0.2311 | |
|
previous
or next day for the same group /
back to the solar disc Gyula 2000-03-19 07:58:11 UT |
| spot | Proj. U | Proj. WS | Corr. U | Corr. WS | B | L | LCM | Pos. angle | r |
| 32 | 528 | 16 | 266 | -14.96 | 49.34 | -7.03 | 139.50 | 0.1829 | |
| 16 | -1 | 8 | -1 | -15.42 | 48.67 | -7.70 | 138.60 | 0.1962 | |
| 1 | -1 | 0 | -1 | -15.67 | 48.72 | -7.65 | 139.63 | 0.1989 | |
| 0 | 1 | 0 | 1 | -13.76 | 47.65 | -8.73 | 128.72 | 0.1897 | |
| 12 | -1 | 6 | -1 | -15.48 | 47.94 | -8.43 | 136.26 | 0.2054 | |
| 5 | -1 | 3 | -1 | -15.13 | 47.54 | -8.83 | 133.74 | 0.2060 | |
| 4 | -1 | 2 | -1 | -15.58 | 47.52 | -8.85 | 135.28 | 0.2115 | |
| 6 | -1 | 3 | -1 | -16.10 | 47.22 | -9.15 | 136.07 | 0.2213 | |
| 0 | 1 | 0 | 0 | -16.89 | 47.34 | -9.01 | 138.97 | 0.2293 | |
| 0 | 3 | 0 | 2 | -15.28 | 46.55 | -9.82 | 131.35 | 0.2202 | |
| 0 | 1 | 0 | 1 | -15.44 | 46.67 | -9.66 | 132.36 | 0.2199 | |
| 0 | 1 | 0 | 1 | -15.30 | 46.05 | -10.30 | 130.14 | 0.2266 | |
| 0 | 2 | 0 | 1 | -17.07 | 46.67 | -9.70 | 137.45 | 0.2393 | |
| 0 | 3 | 0 | 2 | -15.38 | 45.10 | -11.27 | 127.98 | 0.2402 | |
| 0 | 1 | 0 | 1 | -17.23 | 45.59 | -10.77 | 135.06 | 0.2537 | |
| 0 | 1 | 0 | 0 | -17.45 | 45.56 | -10.81 | 135.58 | 0.2568 | |
| 0 | 1 | 0 | 0 | -16.24 | 44.87 | -11.50 | 130.24 | 0.2518 | |
| 0 | 1 | 0 | 0 | -16.62 | 44.87 | -11.50 | 131.40 | 0.2559 | |
| 0 | 1 | 0 | 1 | -17.97 | 45.47 | -10.90 | 136.78 | 0.2639 | |
| 11 | 62 | 6 | 32 | -15.64 | 44.17 | -12.20 | 126.75 | 0.2552 | |
| 0 | 1 | 0 | 0 | -17.07 | 44.52 | -11.85 | 131.93 | 0.2651 | |
| 1 | 9 | 0 | 5 | -15.96 | 43.55 | -12.82 | 126.47 | 0.2665 | |
| 0 | 1 | 0 | 0 | -14.70 | 43.10 | -13.23 | 121.59 | 0.2610 | |
| 0 | 0 | 0 | 0 | -15.78 | 43.25 | -13.12 | 125.31 | 0.2689 | |
| 0 | 2 | 0 | 1 | -17.37 | 43.67 | -12.68 | 130.96 | 0.2787 | |
| 14 | 115 | 7 | 59 | -16.33 | 43.04 | -13.33 | 126.61 | 0.2769 | |
| -26 | -26 | -26 | -26 | -16.56 | 43.04 | -13.33 | 127.30 | 0.2790 | |
| -26 | -26 | -26 | -26 | -16.89 | 42.91 | -13.46 | 128.01 | 0.2840 | |
| 0 | 3 | 0 | 2 | -17.68 | 43.30 | -13.07 | 131.00 | 0.2868 | |
| 11 | -26 | 6 | -26 | -17.12 | 42.37 | -14.00 | 127.62 | 0.2933 | |
| 0 | 2 | 0 | 1 | -16.88 | 41.50 | -14.87 | 125.40 | 0.3026 | |
| 0 | 2 | 0 | 1 | -17.08 | 41.16 | -15.21 | 125.39 | 0.3091 | |
| 0 | 2 | 0 | 1 | -17.08 | 40.89 | -15.46 | 124.99 | 0.3125 | |
| 0 | 3 | 0 | 2 | -17.76 | 40.81 | -15.56 | 126.66 | 0.3199 | |
| 0 | 1 | 0 | 1 | -18.57 | 40.95 | -15.42 | 128.95 | 0.3256 | |
| 4 | 88 | 2 | 46 | -16.89 | 40.22 | -16.16 | 123.40 | 0.3203 | |
| 0 | 1 | 0 | 0 | -18.63 | 40.70 | -15.63 | 128.74 | 0.3289 | |
| 4 | -36 | 2 | -36 | -17.30 | 39.89 | -16.48 | 124.00 | 0.3281 | |
| 0 | 5 | 0 | 2 | -18.17 | 40.07 | -16.30 | 126.52 | 0.3332 | |
| Proj. U | - Projected umbra area in millionths of solar disc, negative values indicate | |
|
that the umbra consists of fragmented regions which cannot be separated without losing umbral area. In this way several spots (intensity minima in the umbra) have a common umbra, e.g. -2 means that the given spot shares an umbra with spot No.2, and the common U value is indicated at spot No.2. |
||
| Proj. WS | - Projected whole spot area in millionths of solar disc, negative values indicate | |
|
that several umbras have a common penumbra, e.g. -7 means that the given umbra shares a penumbra with umbra No.7, and the WS value is indicated at No.7. |
||
| Corr. U | - Corrected umbra area in millionths of solar hemisphere, for negative values see above | |
| Corr. WS | - Corrected whole spot area in millionths of solar hemisphere, for negative values see above | |
| B | - Heliographic latitude B; positive: North, negative: South | |
| L | - Heliographic longitude L | |
| LCM | - Longitudinal distance from the Sun's central meridian | |
| Pos. angle | - Position angle | |
| r | - Distance from the centre of Sun's disc in terms of Sun's radius | |