Gyula 2000-04-25 10:14:19 UT
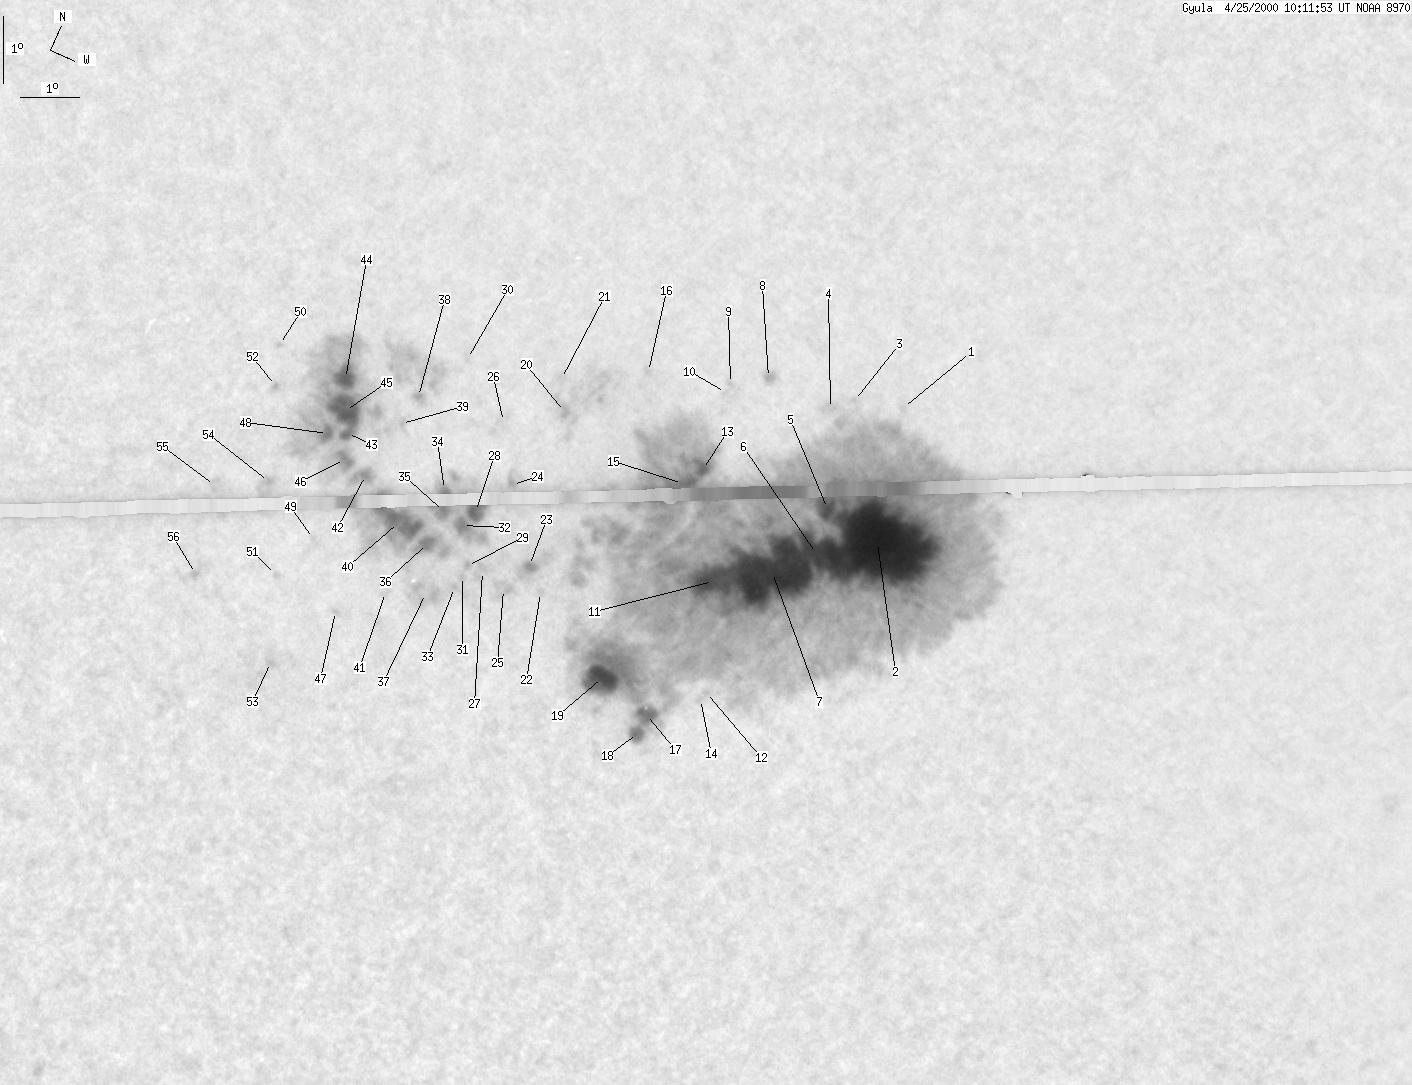
| group | Proj. U | Proj. WS | Corr. U | Corr. WS | B | L | LCM | Pos. angle | r |
| 401 | 2879 | 219 | 1568 | -13.94 | 264.07 | -22.75 | 114.12 | 0.4122 | |
|
previous
or next day for the same group /
back to the solar disc Gyula 2000-04-25 10:14:19 UT |
| spot | Proj. U | Proj. WS | Corr. U | Corr. WS | B | L | LCM | Pos. angle | r |
| 0 | 2 | 0 | 1 | -10.88 | 266.47 | -20.37 | 108.32 | 0.3615 | |
| 314 | 2264 | 169 | 1218 | -12.98 | 266.97 | -19.85 | 114.25 | 0.3645 | |
| 0 | 1 | 0 | 0 | -11.07 | 265.66 | -21.18 | 108.22 | 0.3748 | |
| 0 | 4 | 0 | 2 | -11.32 | 265.33 | -21.51 | 108.63 | 0.3811 | |
| -2 | -2 | -2 | -2 | -12.79 | 265.90 | -20.94 | 112.80 | 0.3796 | |
| -2 | -2 | -2 | -2 | -13.50 | 265.99 | -20.82 | 114.64 | 0.3820 | |
| -2 | -2 | -2 | -2 | -14.06 | 265.30 | -21.52 | 115.34 | 0.3953 | |
| 0 | 2 | 0 | 1 | -11.26 | 264.22 | -22.60 | 107.77 | 0.3974 | |
| 0 | 1 | 0 | 1 | -11.56 | 263.58 | -23.24 | 108.10 | 0.4084 | |
| 0 | 0 | 0 | 0 | -11.68 | 263.60 | -23.23 | 108.38 | 0.4088 | |
| -2 | -2 | -2 | -2 | -14.51 | 264.43 | -22.39 | 115.60 | 0.4106 | |
| 0 | 1 | 0 | 1 | -16.13 | 264.87 | -21.97 | 119.61 | 0.4151 | |
| 2 | -2 | 1 | -2 | -12.98 | 263.66 | -23.15 | 111.49 | 0.4135 | |
| 0 | 1 | 0 | 1 | -16.29 | 264.85 | -21.98 | 119.95 | 0.4164 | |
| 5 | -2 | 3 | -2 | -13.27 | 263.39 | -23.42 | 111.95 | 0.4189 | |
| 0 | 2 | 0 | 1 | -11.87 | 262.21 | -24.61 | 108.00 | 0.4303 | |
| 4 | -2 | 2 | -2 | -16.84 | 264.05 | -22.76 | 120.35 | 0.4309 | |
| 1 | -2 | 1 | -2 | -17.19 | 263.97 | -22.84 | 121.01 | 0.4344 | |
| 12 | -2 | 7 | -2 | -16.57 | 263.12 | -23.70 | 118.91 | 0.4419 | |
| 2 | 42 | 1 | 23 | -12.92 | 261.05 | -25.77 | 109.64 | 0.4518 | |
| 0 | 3 | 0 | 2 | -12.42 | 260.79 | -26.05 | 108.43 | 0.4539 | |
| 0 | 1 | 0 | 0 | -15.64 | 261.58 | -25.26 | 115.68 | 0.4579 | |
| 0 | 11 | 0 | 6 | -15.33 | 261.31 | -25.52 | 114.85 | 0.4599 | |
| 0 | 2 | 0 | 1 | -14.23 | 260.54 | -26.30 | 112.07 | 0.4653 | |
| 0 | 6 | 0 | 4 | -15.82 | 260.99 | -25.84 | 115.62 | 0.4670 | |
| 0 | 3 | 0 | 2 | -13.47 | 260.05 | -26.77 | 110.23 | 0.4687 | |
| 0 | 6 | 0 | 3 | -15.66 | 260.55 | -26.28 | 114.98 | 0.4723 | |
| 4 | 405 | 2 | 231 | -14.86 | 260.11 | -26.72 | 113.08 | 0.4744 | |
| 0 | 2 | 0 | 1 | -15.68 | 260.25 | -26.59 | 114.81 | 0.4766 | |
| 0 | 1 | 0 | 1 | -12.66 | 259.10 | -27.73 | 108.06 | 0.4796 | |
| 0 | 2 | 0 | 1 | -15.87 | 260.22 | -26.61 | 115.16 | 0.4779 | |
| 3 | -28 | 2 | -28 | -15.17 | 259.99 | -26.83 | 113.62 | 0.4774 | |
| 0 | 1 | 0 | 1 | -16.06 | 260.08 | -26.75 | 115.43 | 0.4809 | |
| 3 | 24 | 2 | 13 | -14.69 | 259.41 | -27.43 | 112.30 | 0.4836 | |
| 2 | -28 | 1 | -28 | -15.01 | 259.50 | -27.33 | 113.00 | 0.4837 | |
| 3 | -28 | 2 | -28 | -15.61 | 259.41 | -27.40 | 114.11 | 0.4877 | |
| 0 | 19 | 0 | 11 | -16.31 | 259.61 | -27.22 | 115.59 | 0.4888 | |
| 0 | 62 | 0 | 36 | -13.52 | 258.51 | -28.31 | 109.49 | 0.4910 | |
| 0 | 2 | 0 | 1 | -13.97 | 258.32 | -28.52 | 110.28 | 0.4959 | |
| 22 | -28 | 13 | -28 | -15.47 | 258.82 | -28.00 | 113.48 | 0.4952 | |
| 0 | 1 | 0 | 1 | -16.52 | 258.91 | -27.93 | 115.52 | 0.4995 | |
| 2 | -28 | 1 | -28 | -14.97 | 258.11 | -28.71 | 112.09 | 0.5028 | |
| 2 | -28 | 1 | -28 | -14.48 | 257.53 | -29.28 | 110.85 | 0.5088 | |
| 4 | -28 | 2 | -28 | -13.70 | 257.23 | -29.59 | 109.22 | 0.5101 | |
| 11 | -28 | 6 | -28 | -14.14 | 257.38 | -29.43 | 110.12 | 0.5095 | |
| 3 | -28 | 2 | -28 | -14.85 | 257.65 | -29.16 | 111.61 | 0.5087 | |
| 0 | 0 | 0 | 0 | -17.14 | 258.22 | -28.60 | 116.23 | 0.5119 | |
| 2 | -28 | 1 | -28 | -14.56 | 257.21 | -29.60 | 110.83 | 0.5136 | |
| 0 | 0 | 0 | 0 | -16.14 | 257.37 | -29.46 | 113.85 | 0.5187 | |
| 0 | 1 | 0 | 1 | -13.55 | 255.80 | -31.02 | 108.30 | 0.5298 | |
| 0 | 0 | 0 | 0 | -16.93 | 256.93 | -29.89 | 115.03 | 0.5282 | |
| 0 | 1 | 0 | 0 | -14.20 | 256.05 | -30.76 | 109.61 | 0.5285 | |
| 0 | 1 | 0 | 0 | -18.23 | 257.24 | -29.58 | 117.54 | 0.5308 | |
| 0 | 2 | 0 | 1 | -15.71 | 256.39 | -30.42 | 112.53 | 0.5298 | |
| 0 | 2 | 0 | 1 | -16.00 | 255.43 | -31.38 | 112.55 | 0.5441 | |
| 0 | 1 | 0 | 1 | -17.41 | 255.51 | -31.30 | 115.05 | 0.5494 | |
| Proj. U | - Projected umbra area in millionths of solar disc, negative values indicate | |
|
that the umbra consists of fragmented regions which cannot be separated without losing umbral area. In this way several spots (intensity minima in the umbra) have a common umbra, e.g. -2 means that the given spot shares an umbra with spot No.2, and the common U value is indicated at spot No.2. |
||
| Proj. WS | - Projected whole spot area in millionths of solar disc, negative values indicate | |
|
that several umbras have a common penumbra, e.g. -7 means that the given umbra shares a penumbra with umbra No.7, and the WS value is indicated at No.7. |
||
| Corr. U | - Corrected umbra area in millionths of solar hemisphere, for negative values see above | |
| Corr. WS | - Corrected whole spot area in millionths of solar hemisphere, for negative values see above | |
| B | - Heliographic latitude B; positive: North, negative: South | |
| L | - Heliographic longitude L | |
| LCM | - Longitudinal distance from the Sun's central meridian | |
| Pos. angle | - Position angle | |
| r | - Distance from the centre of Sun's disc in terms of Sun's radius | |