Gyula 2000-05-17 10:34:41 UT
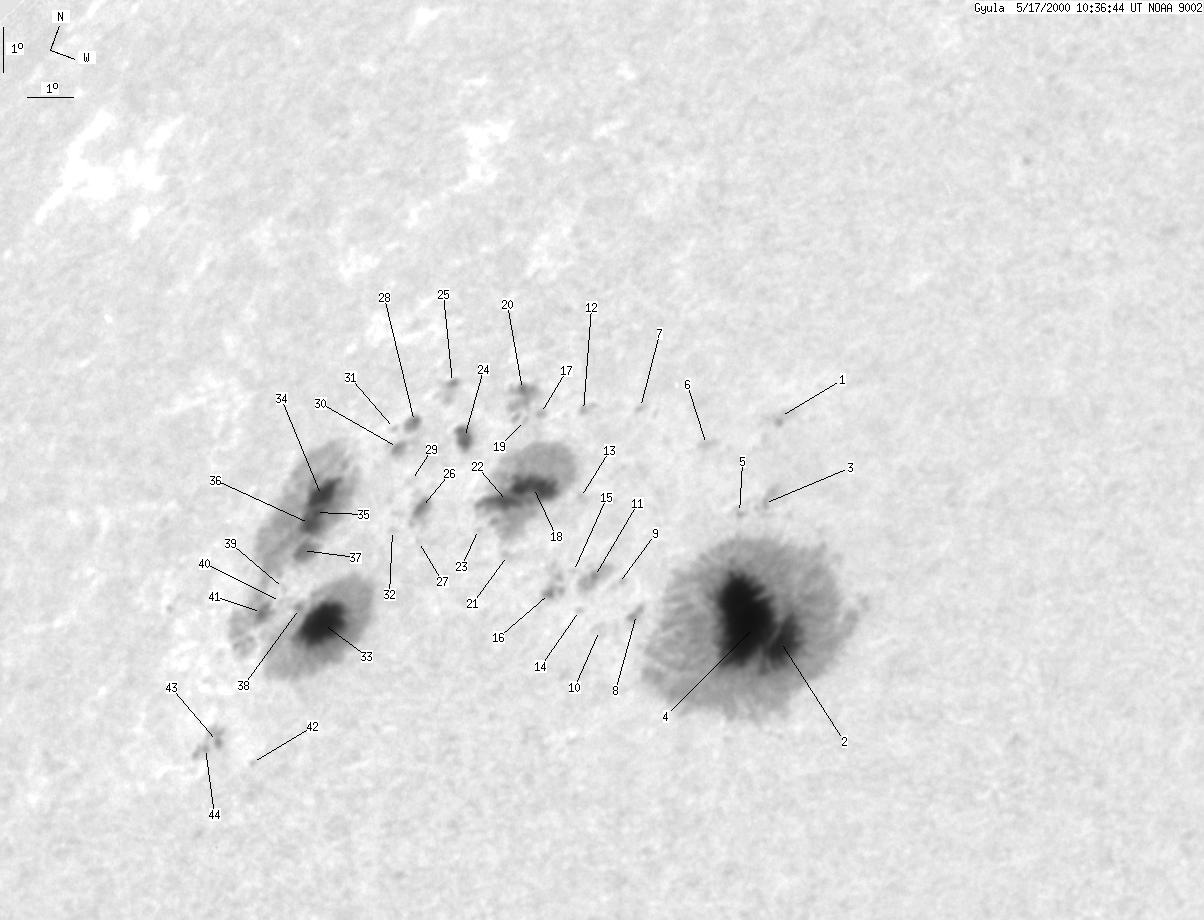
| group | Proj. U | Proj. WS | Corr. U | Corr. WS | B | L | LCM | Pos. angle | r |
| 215 | 1433 | 170 | 1152 | 19.15 | 307.74 | -48.04 | 63.07 | 0.7872 | |
|
previous
or next day for the same group /
back to the solar disc Gyula 2000-05-17 10:34:41 UT |
| spot | Proj. U | Proj. WS | Corr. U | Corr. WS | B | L | LCM | Pos. angle | r |
| 0 | 6 | 0 | 4 | 22.94 | 310.02 | -45.76 | 57.79 | 0.7821 | |
| 134 | 696 | 98 | 510 | 19.38 | 313.18 | -42.61 | 60.59 | 0.7354 | |
| 0 | 10 | 0 | 7 | 21.50 | 310.91 | -44.87 | 59.07 | 0.7675 | |
| -2 | -2 | -2 | -2 | 19.41 | 312.50 | -43.27 | 60.87 | 0.7423 | |
| 0 | 2 | 0 | 2 | 21.20 | 310.61 | -45.16 | 59.57 | 0.7690 | |
| 0 | 3 | 0 | 2 | 22.14 | 308.91 | -46.87 | 59.22 | 0.7890 | |
| 0 | 1 | 0 | 1 | 22.40 | 306.91 | -48.87 | 59.77 | 0.8081 | |
| 0 | 5 | 0 | 4 | 19.01 | 309.99 | -45.79 | 62.52 | 0.7661 | |
| 0 | 2 | 0 | 1 | 19.41 | 309.20 | -46.57 | 62.37 | 0.7754 | |
| 0 | 3 | 0 | 2 | 18.57 | 309.47 | -46.30 | 63.28 | 0.7695 | |
| 1 | 11 | 0 | 9 | 19.47 | 308.56 | -47.23 | 62.56 | 0.7820 | |
| 0 | 2 | 0 | 2 | 22.02 | 305.76 | -50.00 | 60.67 | 0.8168 | |
| 0 | 1 | 0 | 0 | 20.59 | 307.12 | -48.65 | 61.80 | 0.7996 | |
| 0 | 1 | 0 | 1 | 18.78 | 308.78 | -46.99 | 63.30 | 0.7771 | |
| 0 | 0 | 0 | 0 | 19.37 | 308.09 | -47.67 | 62.87 | 0.7860 | |
| 1 | 19 | 1 | 15 | 18.98 | 307.85 | -47.93 | 63.44 | 0.7871 | |
| 0 | 2 | 0 | 1 | 21.75 | 304.87 | -50.90 | 61.32 | 0.8237 | |
| 11 | 146 | 9 | 123 | 20.55 | 305.88 | -49.89 | 62.34 | 0.8108 | |
| 0 | 1 | 0 | 1 | 21.56 | 304.63 | -51.14 | 61.64 | 0.8251 | |
| 1 | 17 | 1 | 15 | 22.10 | 303.98 | -51.81 | 61.26 | 0.8327 | |
| 0 | 2 | 0 | 2 | 19.33 | 306.39 | -49.38 | 63.57 | 0.8021 | |
| 6 | -18 | 5 | -18 | 20.22 | 305.53 | -50.26 | 62.85 | 0.8130 | |
| 0 | 0 | 0 | 0 | 19.60 | 305.41 | -50.36 | 63.63 | 0.8120 | |
| 3 | 10 | 3 | 9 | 21.03 | 303.53 | -52.25 | 62.64 | 0.8331 | |
| 0 | 6 | 0 | 6 | 21.83 | 302.27 | -53.52 | 62.17 | 0.8461 | |
| 3 | 23 | 3 | 21 | 19.69 | 303.78 | -52.01 | 64.10 | 0.8271 | |
| 0 | 1 | 0 | 1 | 19.07 | 304.28 | -51.49 | 64.64 | 0.8206 | |
| 1 | 4 | 1 | 4 | 21.01 | 302.13 | -53.66 | 63.13 | 0.8450 | |
| 0 | 1 | 0 | 1 | 20.01 | 303.10 | -52.66 | 63.95 | 0.8337 | |
| 1 | 8 | 1 | 7 | 20.53 | 302.21 | -53.58 | 63.65 | 0.8430 | |
| 0 | 1 | 0 | 1 | 20.77 | 301.78 | -53.99 | 63.52 | 0.8471 | |
| 0 | 1 | 0 | 1 | 19.11 | 303.51 | -52.26 | 64.85 | 0.8276 | |
| 27 | 439 | 24 | 392 | 17.37 | 303.39 | -52.40 | 66.93 | 0.8240 | |
| 21 | -33 | 19 | -33 | 19.39 | 301.22 | -54.56 | 65.26 | 0.8483 | |
| -34 | -33 | -34 | -33 | 19.04 | 301.43 | -54.35 | 65.59 | 0.8456 | |
| -34 | -33 | -34 | -33 | 18.88 | 301.43 | -54.36 | 65.78 | 0.8453 | |
| 2 | -33 | 2 | -33 | 18.36 | 301.77 | -54.01 | 66.27 | 0.8409 | |
| 1 | -33 | 1 | -33 | 17.41 | 302.64 | -53.13 | 67.10 | 0.8308 | |
| 0 | 2 | 0 | 1 | 17.65 | 301.94 | -53.83 | 67.03 | 0.8376 | |
| 0 | 0 | 0 | 0 | 17.43 | 302.08 | -53.69 | 67.25 | 0.8358 | |
| 2 | -33 | 2 | -33 | 17.18 | 301.79 | -53.99 | 67.62 | 0.8378 | |
| 0 | 0 | 0 | 0 | 14.77 | 303.90 | -51.87 | 69.84 | 0.8124 | |
| 0 | 5 | 0 | 4 | 14.96 | 302.75 | -53.02 | 69.95 | 0.8238 | |
| 0 | 2 | 0 | 2 | 14.83 | 302.55 | -53.24 | 70.16 | 0.8255 | |
| Proj. U | - Projected umbra area in millionths of solar disc, negative values indicate | |
|
that the umbra consists of fragmented regions which cannot be separated without losing umbral area. In this way several spots (intensity minima in the umbra) have a common umbra, e.g. -2 means that the given spot shares an umbra with spot No.2, and the common U value is indicated at spot No.2. |
||
| Proj. WS | - Projected whole spot area in millionths of solar disc, negative values indicate | |
|
that several umbras have a common penumbra, e.g. -7 means that the given umbra shares a penumbra with umbra No.7, and the WS value is indicated at No.7. |
||
| Corr. U | - Corrected umbra area in millionths of solar hemisphere, for negative values see above | |
| Corr. WS | - Corrected whole spot area in millionths of solar hemisphere, for negative values see above | |
| B | - Heliographic latitude B; positive: North, negative: South | |
| L | - Heliographic longitude L | |
| LCM | - Longitudinal distance from the Sun's central meridian | |
| Pos. angle | - Position angle | |
| r | - Distance from the centre of Sun's disc in terms of Sun's radius | |