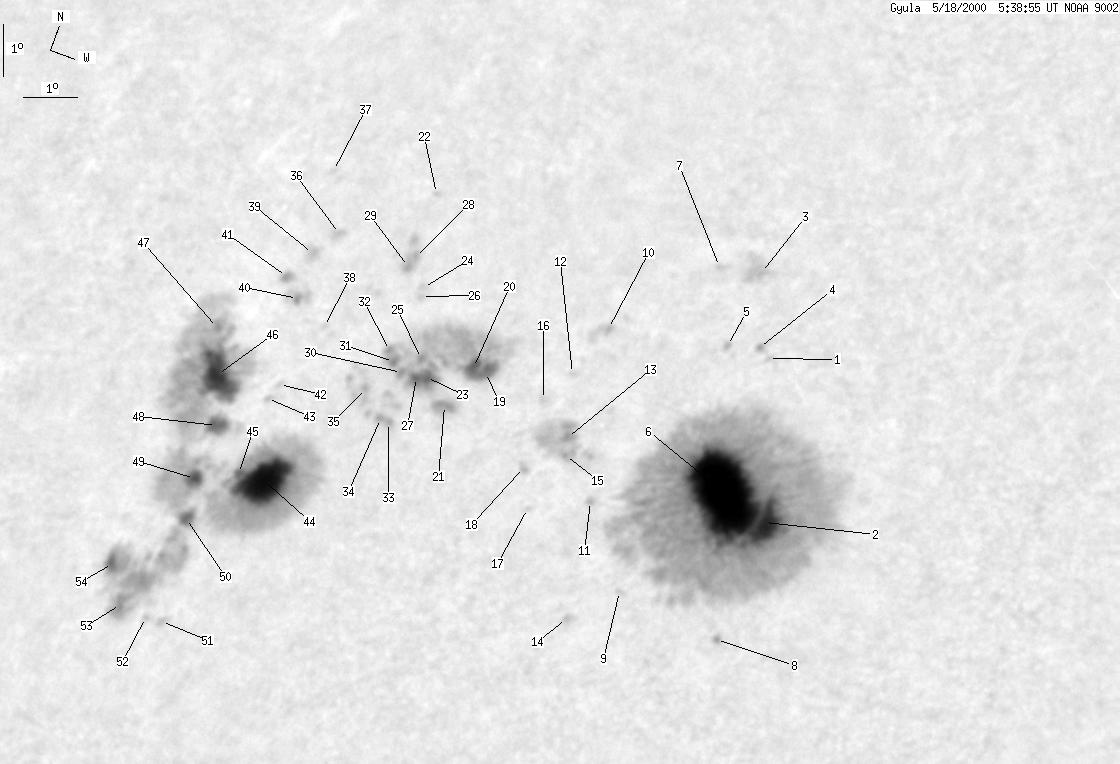
Gyula 2000-05-18 05:37:29 UT
| group | Proj. U | Proj. WS | Corr. U | Corr. WS | B | L | LCM | Pos. angle | r |
| 240 | 1845 | 162 | 1251 | 18.93 | 307.47 | -37.82 | 58.31 | 0.6814 | |
|
previous
or next day for the same group /
back to the solar disc Gyula 2000-05-18 05:37:29 UT |
| spot | Proj. U | Proj. WS | Corr. U | Corr. WS | B | L | LCM | Pos. angle | r |
| 0 | 1 | 0 | 0 | 22.06 | 311.20 | -34.08 | 52.02 | 0.6611 | |
| 133 | 871 | 85 | 555 | 19.35 | 312.94 | -32.34 | 54.31 | 0.6237 | |
| 0 | 10 | 0 | 7 | 23.37 | 310.08 | -35.21 | 51.18 | 0.6816 | |
| 0 | 1 | 0 | 1 | 22.14 | 310.93 | -34.35 | 52.12 | 0.6645 | |
| 0 | 1 | 0 | 1 | 22.00 | 310.38 | -34.91 | 52.70 | 0.6693 | |
| -2 | -2 | -2 | -2 | 19.58 | 311.96 | -33.33 | 54.75 | 0.6362 | |
| 0 | 1 | 0 | 1 | 23.27 | 309.29 | -35.99 | 51.86 | 0.6887 | |
| 0 | 3 | 0 | 2 | 17.27 | 313.25 | -32.04 | 57.03 | 0.6060 | |
| 0 | 1 | 0 | 0 | 17.54 | 311.18 | -34.10 | 58.14 | 0.6317 | |
| 0 | 5 | 0 | 4 | 21.65 | 308.00 | -37.29 | 54.76 | 0.6918 | |
| 0 | 1 | 0 | 1 | 18.77 | 309.69 | -35.60 | 57.44 | 0.6561 | |
| 0 | 0 | 0 | 0 | 20.75 | 307.93 | -37.35 | 55.96 | 0.6870 | |
| 1 | 47 | 1 | 32 | 19.70 | 308.53 | -36.75 | 56.95 | 0.6744 | |
| 0 | 1 | 0 | 1 | 16.83 | 310.51 | -34.78 | 59.61 | 0.6352 | |
| 1 | -13 | 0 | -13 | 19.41 | 308.75 | -36.52 | 57.18 | 0.6702 | |
| 0 | 2 | 0 | 1 | 20.19 | 307.72 | -37.55 | 56.82 | 0.6858 | |
| 0 | 1 | 0 | 0 | 18.38 | 308.66 | -36.62 | 58.63 | 0.6652 | |
| 0 | 2 | 0 | 1 | 19.00 | 308.14 | -37.14 | 58.12 | 0.6745 | |
| 8 | 149 | 6 | 104 | 20.34 | 306.33 | -38.96 | 57.47 | 0.7015 | |
| -19 | -19 | -19 | -19 | 20.36 | 306.04 | -39.25 | 57.62 | 0.7047 | |
| 2 | -19 | 2 | -19 | 19.55 | 305.97 | -39.32 | 58.70 | 0.7012 | |
| 0 | 0 | 0 | 0 | 22.93 | 303.04 | -42.25 | 56.09 | 0.7483 | |
| 3 | -19 | 2 | -19 | 19.93 | 305.27 | -40.01 | 58.60 | 0.7105 | |
| 0 | 1 | 0 | 1 | 21.37 | 304.12 | -41.17 | 57.42 | 0.7298 | |
| 1 | -19 | 0 | -19 | 20.21 | 304.93 | -40.36 | 58.44 | 0.7156 | |
| 0 | 1 | 0 | 1 | 21.20 | 304.21 | -41.07 | 57.58 | 0.7279 | |
| 2 | -19 | 2 | -19 | 19.87 | 305.07 | -40.21 | 58.79 | 0.7123 | |
| 1 | 14 | 1 | 10 | 21.80 | 303.58 | -41.70 | 57.18 | 0.7372 | |
| 1 | -28 | 1 | -28 | 21.63 | 303.48 | -41.80 | 57.45 | 0.7374 | |
| 0 | -19 | 0 | -19 | 19.88 | 304.79 | -40.48 | 58.93 | 0.7151 | |
| 0 | -19 | 0 | -19 | 20.03 | 304.47 | -40.82 | 58.91 | 0.7194 | |
| 1 | -19 | 0 | -19 | 20.17 | 304.29 | -40.98 | 58.83 | 0.7218 | |
| 1 | 44 | 1 | 31 | 19.02 | 305.16 | -40.12 | 59.83 | 0.7069 | |
| 1 | -33 | 1 | -33 | 19.01 | 304.93 | -40.36 | 59.97 | 0.7095 | |
| 1 | -33 | 0 | -33 | 19.45 | 304.29 | -41.00 | 59.75 | 0.7184 | |
| 0 | 2 | 0 | 1 | 21.83 | 301.71 | -43.58 | 58.12 | 0.7559 | |
| 0 | 1 | 0 | 0 | 22.78 | 300.75 | -44.52 | 57.44 | 0.7693 | |
| 0 | 1 | 0 | 1 | 20.22 | 302.75 | -42.53 | 59.58 | 0.7379 | |
| 0 | 9 | 0 | 7 | 21.38 | 301.44 | -43.85 | 58.80 | 0.7564 | |
| 1 | 8 | 1 | 6 | 20.58 | 301.76 | -43.53 | 59.62 | 0.7497 | |
| 1 | 3 | 0 | 2 | 20.86 | 301.22 | -44.07 | 59.53 | 0.7563 | |
| 0 | 1 | 0 | 1 | 19.05 | 302.62 | -42.67 | 61.10 | 0.7340 | |
| 0 | 1 | 0 | 1 | 18.73 | 302.50 | -42.79 | 61.57 | 0.7338 | |
| 39 | 659 | 27 | 476 | 17.41 | 303.46 | -41.83 | 62.81 | 0.7178 | |
| 1 | -44 | 1 | -44 | 17.42 | 302.92 | -42.36 | 63.05 | 0.7236 | |
| 25 | -44 | 19 | -44 | 18.86 | 301.19 | -44.10 | 62.02 | 0.7479 | |
| 1 | -44 | 1 | -44 | 19.65 | 300.67 | -44.61 | 61.28 | 0.7564 | |
| 4 | -44 | 3 | -44 | 18.06 | 301.85 | -43.44 | 62.74 | 0.7377 | |
| 4 | -44 | 3 | -44 | 17.11 | 302.05 | -43.24 | 63.85 | 0.7316 | |
| 2 | -44 | 1 | -44 | 16.45 | 302.38 | -42.91 | 64.56 | 0.7253 | |
| 0 | 2 | 0 | 1 | 14.74 | 303.06 | -42.23 | 66.51 | 0.7110 | |
| 0 | 1 | 0 | 1 | 14.74 | 302.71 | -42.58 | 66.66 | 0.7149 | |
| 3 | -44 | 2 | -44 | 14.81 | 302.13 | -43.16 | 66.82 | 0.7216 | |
| 2 | -44 | 2 | -44 | 15.39 | 301.49 | -43.79 | 66.32 | 0.7309 | |
| Proj. U | - Projected umbra area in millionths of solar disc, negative values indicate | |
|
that the umbra consists of fragmented regions which cannot be separated without losing umbral area. In this way several spots (intensity minima in the umbra) have a common umbra, e.g. -2 means that the given spot shares an umbra with spot No.2, and the common U value is indicated at spot No.2. |
||
| Proj. WS | - Projected whole spot area in millionths of solar disc, negative values indicate | |
|
that several umbras have a common penumbra, e.g. -7 means that the given umbra shares a penumbra with umbra No.7, and the WS value is indicated at No.7. |
||
| Corr. U | - Corrected umbra area in millionths of solar hemisphere, for negative values see above | |
| Corr. WS | - Corrected whole spot area in millionths of solar hemisphere, for negative values see above | |
| B | - Heliographic latitude B; positive: North, negative: South | |
| L | - Heliographic longitude L | |
| LCM | - Longitudinal distance from the Sun's central meridian | |
| Pos. angle | - Position angle | |
| r | - Distance from the centre of Sun's disc in terms of Sun's radius | |