Gyula 2000-05-22 05:08:06 UT
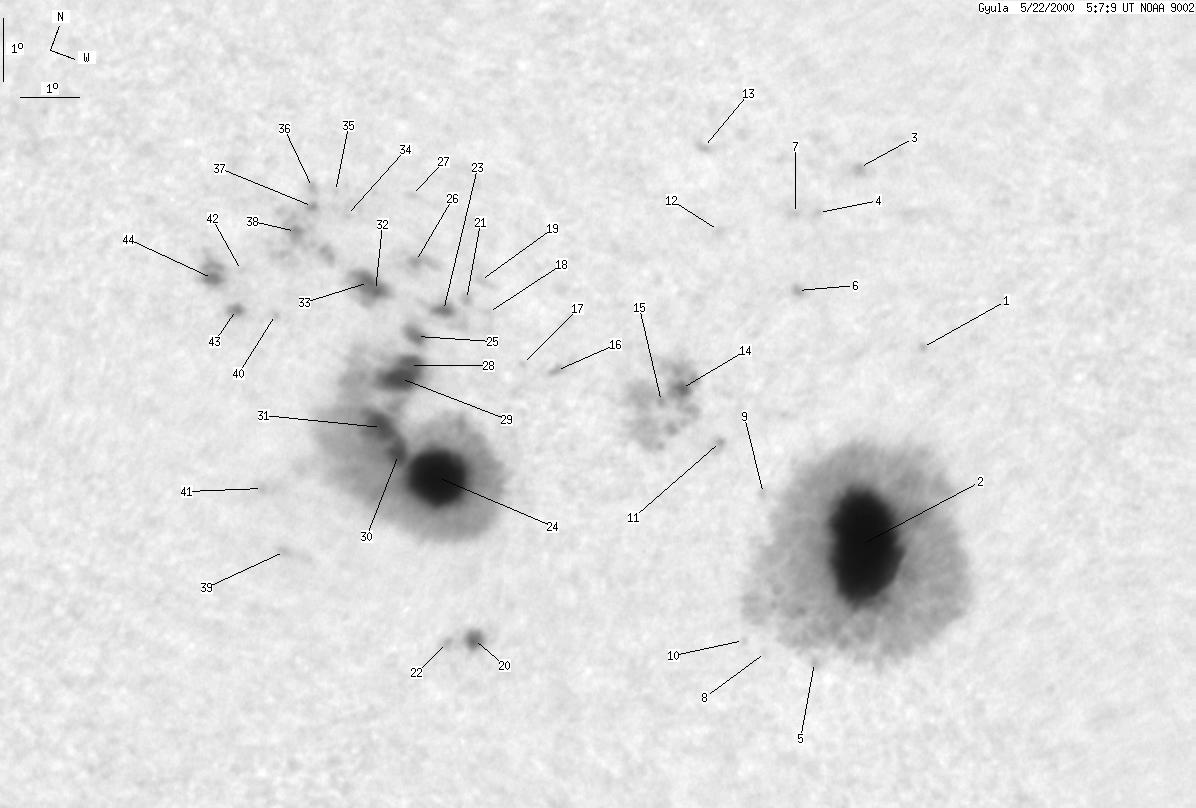
| group | Proj. U | Proj. WS | Corr. U | Corr. WS | B | L | LCM | Pos. angle | r |
| 240 | 1820 | 135 | 1005 | 19.20 | 307.60 | 14.95 | 326.27 | 0.4368 | |
|
previous
or next day for the same group /
back to the solar disc Gyula 2000-05-22 05:08:06 UT |
| spot | Proj. U | Proj. WS | Corr. U | Corr. WS | B | L | LCM | Pos. angle | r |
| 0 | 1 | 0 | 1 | 22.85 | 311.66 | 19.01 | 324.15 | 0.5146 | |
| 135 | 872 | 76 | 489 | 19.38 | 311.41 | 18.76 | 319.84 | 0.4724 | |
| 0 | 2 | 0 | 1 | 25.39 | 309.92 | 17.26 | 329.52 | 0.5306 | |
| 0 | 1 | 0 | 0 | 24.41 | 309.36 | 16.70 | 329.28 | 0.5143 | |
| 0 | 1 | 0 | 1 | 17.31 | 311.02 | 18.37 | 317.27 | 0.4453 | |
| 0 | 3 | 0 | 2 | 23.04 | 309.28 | 16.63 | 327.83 | 0.4966 | |
| 0 | 2 | 0 | 1 | 24.26 | 308.96 | 16.31 | 329.70 | 0.5094 | |
| 0 | 2 | 0 | 1 | 17.19 | 310.17 | 17.52 | 318.40 | 0.4349 | |
| 0 | 2 | 0 | 1 | 19.62 | 309.53 | 16.88 | 323.06 | 0.4569 | |
| 0 | 1 | 0 | 1 | 17.25 | 309.76 | 17.11 | 319.16 | 0.4313 | |
| 0 | 3 | 0 | 2 | 20.21 | 308.56 | 15.91 | 325.43 | 0.4554 | |
| 0 | 1 | 0 | 1 | 23.54 | 307.69 | 15.04 | 330.86 | 0.4907 | |
| 0 | 1 | 0 | 1 | 24.79 | 307.11 | 14.46 | 333.09 | 0.5029 | |
| 3 | 93 | 2 | 52 | 20.83 | 307.73 | 15.08 | 327.64 | 0.4561 | |
| 1 | -14 | 1 | -14 | 20.50 | 307.43 | 14.78 | 327.73 | 0.4494 | |
| 0 | 3 | 0 | 1 | 20.41 | 305.58 | 12.93 | 330.93 | 0.4333 | |
| 0 | 1 | 0 | 0 | 20.29 | 304.97 | 12.32 | 331.93 | 0.4271 | |
| 0 | 4 | 0 | 2 | 20.89 | 304.29 | 11.64 | 333.91 | 0.4304 | |
| 0 | 2 | 0 | 1 | 21.37 | 303.92 | 11.27 | 335.15 | 0.4347 | |
| 4 | 25 | 2 | 14 | 15.73 | 305.47 | 12.82 | 324.58 | 0.3701 | |
| 0 | 2 | 0 | 1 | 21.02 | 303.82 | 11.17 | 334.96 | 0.4291 | |
| 1 | -20 | 0 | -20 | 15.58 | 304.99 | 12.34 | 325.35 | 0.3637 | |
| 1 | 666 | 1 | 358 | 20.71 | 303.49 | 10.84 | 335.27 | 0.4225 | |
| 53 | -23 | 29 | -23 | 18.07 | 304.13 | 11.48 | 330.84 | 0.3900 | |
| 2 | -23 | 1 | -23 | 20.14 | 303.16 | 10.51 | 335.35 | 0.4122 | |
| 0 | 16 | 0 | 9 | 21.32 | 302.84 | 10.19 | 337.20 | 0.4272 | |
| 0 | 1 | 0 | 1 | 22.37 | 302.53 | 9.88 | 338.80 | 0.4404 | |
| 3 | -23 | 2 | -23 | 19.64 | 303.14 | 10.49 | 334.82 | 0.4049 | |
| 8 | -23 | 4 | -23 | 19.41 | 303.10 | 10.45 | 334.65 | 0.4014 | |
| 7 | -23 | 4 | -23 | 18.22 | 303.39 | 10.74 | 332.60 | 0.3864 | |
| 9 | -23 | 5 | -23 | 18.49 | 303.03 | 10.38 | 333.73 | 0.3877 | |
| 3 | 27 | 2 | 15 | 20.63 | 302.32 | 9.67 | 337.58 | 0.4138 | |
| 6 | -32 | 3 | -32 | 20.73 | 302.13 | 9.49 | 338.06 | 0.4142 | |
| 0 | 9 | 0 | 5 | 21.74 | 301.57 | 8.92 | 340.15 | 0.4259 | |
| 0 | 1 | 0 | 1 | 21.96 | 301.16 | 8.51 | 341.18 | 0.4270 | |
| 0 | 1 | 0 | 1 | 21.92 | 300.85 | 8.20 | 341.78 | 0.4248 | |
| 0 | 51 | 0 | 28 | 21.59 | 300.86 | 8.20 | 341.50 | 0.4199 | |
| 1 | -37 | 1 | -37 | 21.10 | 300.79 | 8.14 | 341.24 | 0.4122 | |
| 0 | 2 | 0 | 1 | 16.08 | 302.02 | 9.37 | 332.96 | 0.3456 | |
| 0 | 1 | 0 | 1 | 19.69 | 300.83 | 8.18 | 339.89 | 0.3914 | |
| 0 | 2 | 0 | 1 | 16.92 | 301.38 | 8.73 | 335.63 | 0.3534 | |
| 0 | 1 | 0 | 1 | 20.18 | 300.02 | 7.37 | 342.16 | 0.3945 | |
| 1 | 5 | 1 | 2 | 19.55 | 300.20 | 7.55 | 341.21 | 0.3858 | |
| 2 | 15 | 1 | 8 | 19.96 | 299.66 | 7.01 | 342.80 | 0.3894 | |
| Proj. U | - Projected umbra area in millionths of solar disc, negative values indicate | |
|
that the umbra consists of fragmented regions which cannot be separated without losing umbral area. In this way several spots (intensity minima in the umbra) have a common umbra, e.g. -2 means that the given spot shares an umbra with spot No.2, and the common U value is indicated at spot No.2. |
||
| Proj. WS | - Projected whole spot area in millionths of solar disc, negative values indicate | |
|
that several umbras have a common penumbra, e.g. -7 means that the given umbra shares a penumbra with umbra No.7, and the WS value is indicated at No.7. |
||
| Corr. U | - Corrected umbra area in millionths of solar hemisphere, for negative values see above | |
| Corr. WS | - Corrected whole spot area in millionths of solar hemisphere, for negative values see above | |
| B | - Heliographic latitude B; positive: North, negative: South | |
| L | - Heliographic longitude L | |
| LCM | - Longitudinal distance from the Sun's central meridian | |
| Pos. angle | - Position angle | |
| r | - Distance from the centre of Sun's disc in terms of Sun's radius | |