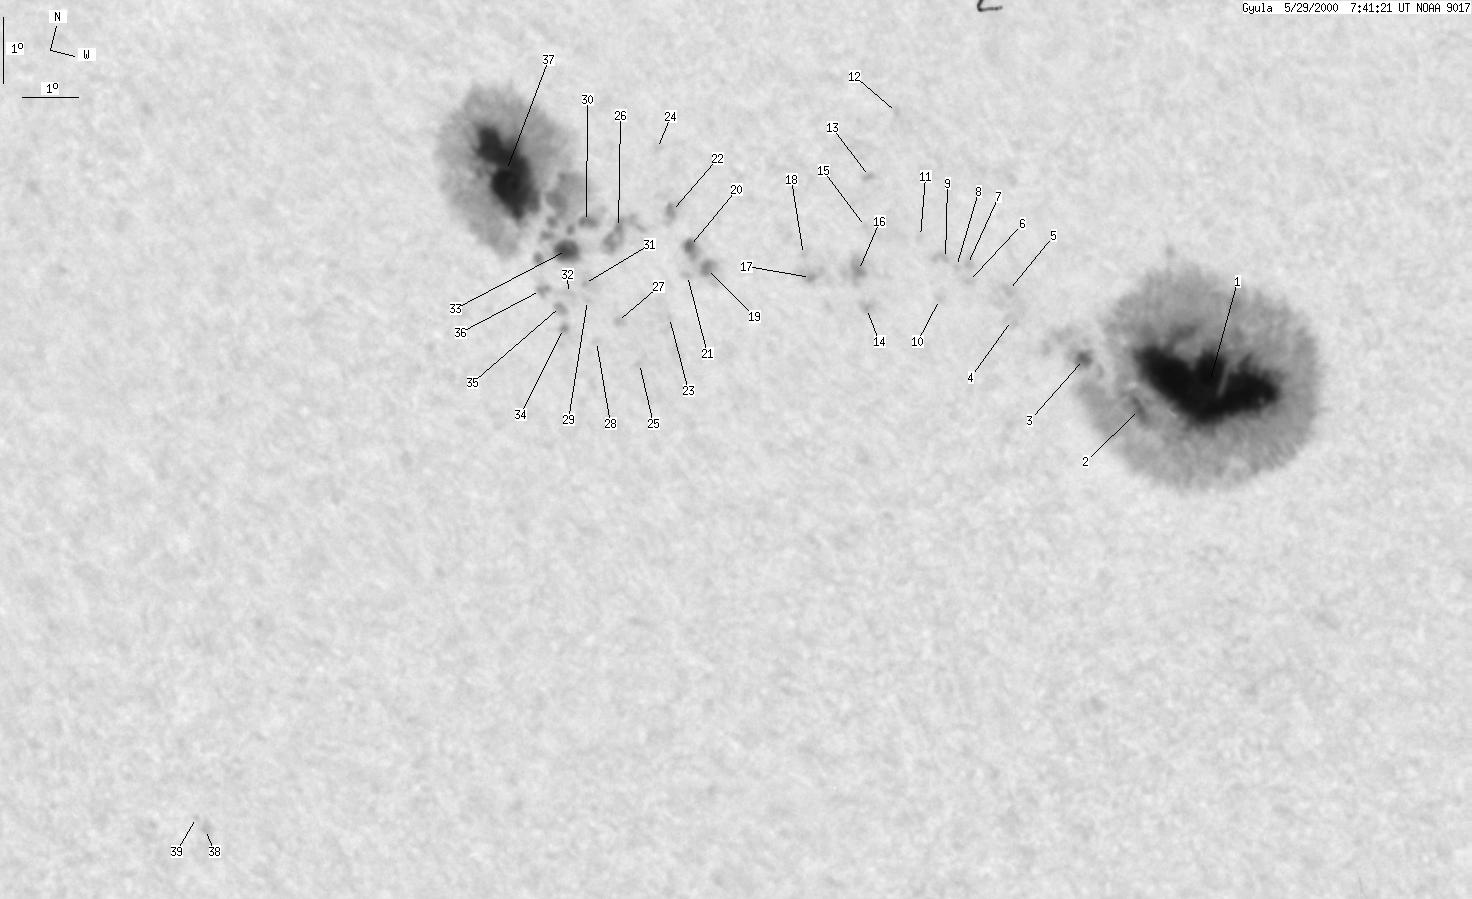
Gyula 2000-05-29 07:43:50 UT
| group | Proj. U | Proj. WS | Corr. U | Corr. WS | B | L | LCM | Pos. angle | r |
| 236 | 1633 | 130 | 902 | -12.77 | 175.55 | -23.05 | 119.54 | 0.4360 | |
|
previous
or next day for the same group /
back to the solar disc Gyula 2000-05-29 07:43:50 UT |
| spot | Proj. U | Proj. WS | Corr. U | Corr. WS | B | L | LCM | Pos. angle | r |
| 149 | 1023 | 79 | 546 | -12.78 | 180.33 | -18.26 | 123.98 | 0.3701 | |
| 6 | -1 | 3 | -1 | -13.44 | 179.30 | -19.30 | 124.05 | 0.3896 | |
| 4 | -1 | 2 | -1 | -12.90 | 178.22 | -20.37 | 121.52 | 0.3997 | |
| 0 | 4 | 0 | 2 | -12.66 | 176.86 | -21.73 | 119.47 | 0.4167 | |
| 0 | 4 | 0 | 2 | -12.25 | 176.71 | -21.88 | 118.43 | 0.4159 | |
| 0 | 1 | 0 | 0 | -12.28 | 175.99 | -22.60 | 117.78 | 0.4262 | |
| 0 | 2 | 0 | 1 | -12.01 | 175.93 | -22.68 | 117.11 | 0.4256 | |
| 0 | 1 | 0 | 1 | -12.09 | 175.75 | -22.87 | 117.12 | 0.4287 | |
| 0 | 3 | 0 | 2 | -12.02 | 175.47 | -23.12 | 116.72 | 0.4318 | |
| 0 | 1 | 0 | 0 | -12.69 | 175.61 | -23.01 | 118.24 | 0.4347 | |
| 0 | 3 | 0 | 2 | -11.81 | 175.07 | -23.54 | 115.91 | 0.4364 | |
| 0 | 1 | 0 | 1 | -10.03 | 174.23 | -24.39 | 111.39 | 0.4385 | |
| 0 | 1 | 0 | 1 | -11.13 | 173.95 | -24.64 | 113.54 | 0.4481 | |
| 0 | 2 | 0 | 1 | -13.15 | 174.31 | -24.29 | 117.99 | 0.4554 | |
| 0 | 1 | 0 | 0 | -11.91 | 174.09 | -24.51 | 115.28 | 0.4507 | |
| 1 | 15 | 1 | 8 | -12.62 | 174.02 | -24.58 | 116.67 | 0.4560 | |
| 1 | 10 | 1 | 6 | -12.91 | 173.24 | -25.36 | 116.59 | 0.4687 | |
| 0 | 1 | 0 | 0 | -12.58 | 173.13 | -25.49 | 115.83 | 0.4685 | |
| 2 | 6 | 1 | 3 | -13.19 | 171.41 | -27.19 | 115.68 | 0.4956 | |
| 2 | 7 | 1 | 4 | -12.94 | 171.06 | -27.53 | 114.96 | 0.4989 | |
| 0 | 2 | 0 | 1 | -13.39 | 171.09 | -27.53 | 115.80 | 0.5014 | |
| 0 | 6 | 0 | 3 | -12.49 | 170.56 | -28.03 | 113.77 | 0.5034 | |
| 0 | 1 | 0 | 1 | -14.11 | 170.96 | -27.66 | 117.02 | 0.5074 | |
| 0 | 1 | 0 | 0 | -11.59 | 170.22 | -28.39 | 111.83 | 0.5038 | |
| 0 | 1 | 0 | 1 | -14.97 | 170.48 | -28.13 | 118.20 | 0.5189 | |
| 0 | 15 | 0 | 9 | -12.95 | 169.77 | -28.84 | 114.07 | 0.5169 | |
| 0 | 2 | 0 | 1 | -14.37 | 170.00 | -28.62 | 116.77 | 0.5217 | |
| 0 | 1 | 0 | 1 | -14.79 | 169.64 | -28.97 | 117.25 | 0.5289 | |
| 0 | 1 | 0 | 0 | -14.20 | 169.43 | -29.19 | 116.07 | 0.5284 | |
| 1 | 503 | 1 | 297 | -13.00 | 169.18 | -29.44 | 113.76 | 0.5253 | |
| 0 | 2 | 0 | 1 | -13.93 | 169.27 | -29.35 | 115.49 | 0.5291 | |
| 0 | 2 | 0 | 1 | -14.17 | 169.03 | -29.57 | 115.76 | 0.5333 | |
| 6 | -30 | 3 | -30 | -13.50 | 168.86 | -29.74 | 114.47 | 0.5320 | |
| 0 | 2 | 0 | 1 | -14.72 | 169.07 | -29.53 | 116.74 | 0.5358 | |
| 0 | 3 | 0 | 2 | -14.40 | 168.93 | -29.66 | 116.09 | 0.5358 | |
| 0 | 3 | 0 | 2 | -14.20 | 168.55 | -30.04 | 115.49 | 0.5397 | |
| 64 | -30 | 38 | -30 | -12.54 | 167.52 | -31.09 | 111.96 | 0.5456 | |
| 0 | 2 | 0 | 1 | -24.17 | 162.88 | -35.74 | 126.70 | 0.6669 | |
| 0 | 0 | 0 | 0 | -24.02 | 162.68 | -35.94 | 126.36 | 0.6681 | |
| Proj. U | - Projected umbra area in millionths of solar disc, negative values indicate | |
|
that the umbra consists of fragmented regions which cannot be separated without losing umbral area. In this way several spots (intensity minima in the umbra) have a common umbra, e.g. -2 means that the given spot shares an umbra with spot No.2, and the common U value is indicated at spot No.2. |
||
| Proj. WS | - Projected whole spot area in millionths of solar disc, negative values indicate | |
|
that several umbras have a common penumbra, e.g. -7 means that the given umbra shares a penumbra with umbra No.7, and the WS value is indicated at No.7. |
||
| Corr. U | - Corrected umbra area in millionths of solar hemisphere, for negative values see above | |
| Corr. WS | - Corrected whole spot area in millionths of solar hemisphere, for negative values see above | |
| B | - Heliographic latitude B; positive: North, negative: South | |
| L | - Heliographic longitude L | |
| LCM | - Longitudinal distance from the Sun's central meridian | |
| Pos. angle | - Position angle | |
| r | - Distance from the centre of Sun's disc in terms of Sun's radius | |