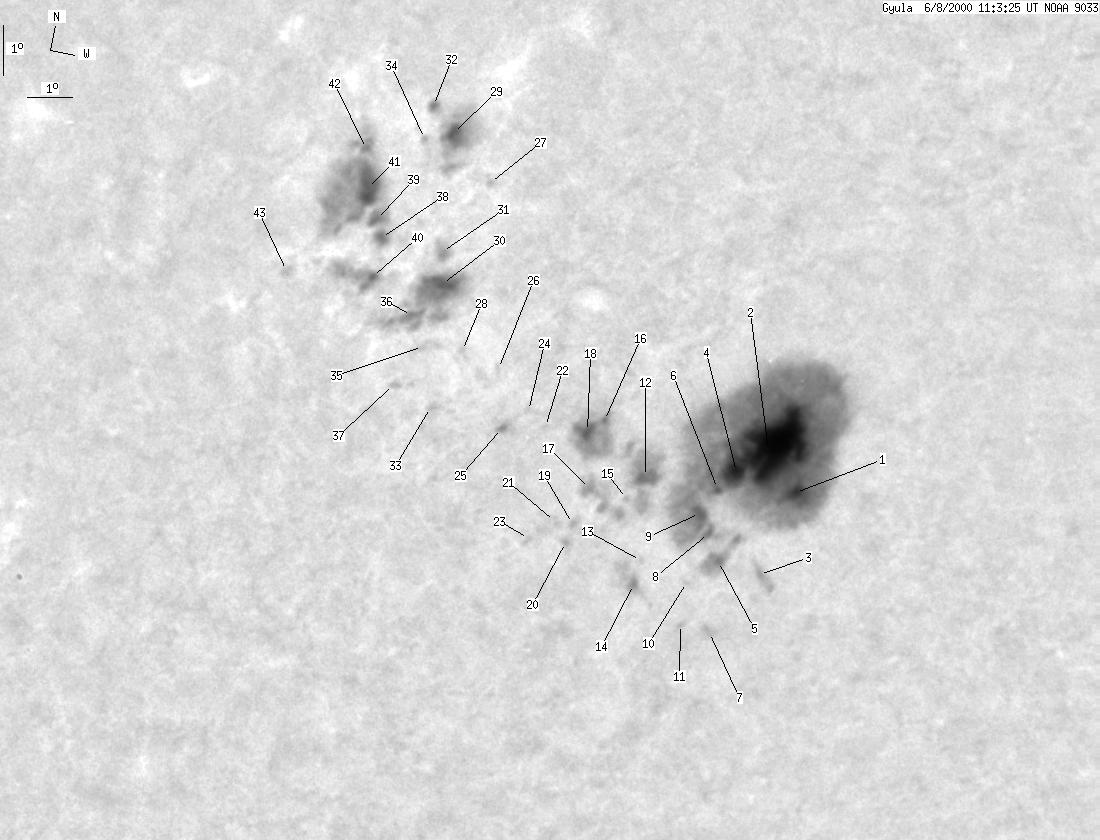
Gyula 2000-06-08 11:01:24 UT
| group | Proj. U | Proj. WS | Corr. U | Corr. WS | B | L | LCM | Pos. angle | r |
| 118 | 982 | 90 | 756 | 22.61 | 18.86 | -45.58 | 59.80 | 0.7610 | |
|
previous
or next day for the same group /
back to the solar disc Gyula 2000-06-08 11:01:24 UT |
| spot | Proj. U | Proj. WS | Corr. U | Corr. WS | B | L | LCM | Pos. angle | r |
| 5 | 598 | 4 | 428 | 21.60 | 23.80 | -40.64 | 58.94 | 0.7092 | |
| 78 | -1 | 56 | -1 | 22.26 | 22.83 | -41.61 | 58.57 | 0.7224 | |
| 0 | 5 | 0 | 4 | 20.18 | 23.84 | -40.59 | 60.79 | 0.7020 | |
| -2 | -1 | -2 | -1 | 21.80 | 22.36 | -42.08 | 59.40 | 0.7252 | |
| 1 | -1 | 1 | -1 | 20.21 | 22.91 | -41.51 | 61.20 | 0.7121 | |
| 1 | -1 | 1 | -1 | 21.37 | 22.07 | -42.35 | 60.09 | 0.7261 | |
| 0 | 5 | 0 | 3 | 19.07 | 23.45 | -40.98 | 62.45 | 0.7013 | |
| 1 | -1 | 1 | -1 | 20.61 | 22.37 | -42.05 | 60.93 | 0.7196 | |
| 3 | -1 | 2 | -1 | 20.87 | 22.01 | -42.42 | 60.75 | 0.7247 | |
| 0 | 1 | 0 | 1 | 19.74 | 22.43 | -41.99 | 62.03 | 0.7152 | |
| 0 | 0 | 0 | 0 | 19.05 | 22.74 | -41.68 | 62.81 | 0.7090 | |
| 4 | 39 | 3 | 29 | 21.31 | 20.48 | -43.94 | 60.88 | 0.7423 | |
| 0 | 1 | 0 | 1 | 19.91 | 21.26 | -43.16 | 62.33 | 0.7285 | |
| 0 | 9 | 0 | 7 | 19.50 | 21.43 | -43.01 | 62.80 | 0.7253 | |
| 0 | 1 | 0 | 0 | 20.85 | 20.28 | -44.13 | 61.54 | 0.7425 | |
| 0 | 38 | 0 | 29 | 22.03 | 18.90 | -45.52 | 60.65 | 0.7611 | |
| 0 | 19 | 0 | 14 | 20.89 | 19.46 | -44.97 | 61.85 | 0.7511 | |
| 3 | -16 | 2 | -16 | 21.84 | 18.75 | -45.69 | 60.96 | 0.7620 | |
| 0 | 1 | 0 | 1 | 20.24 | 19.42 | -45.00 | 62.67 | 0.7490 | |
| 0 | 1 | 0 | 1 | 19.91 | 19.49 | -44.93 | 63.07 | 0.7471 | |
| 0 | 3 | 0 | 2 | 20.21 | 19.01 | -45.40 | 62.88 | 0.7531 | |
| 0 | 1 | 0 | 0 | 21.70 | 17.68 | -46.74 | 61.55 | 0.7718 | |
| 0 | 1 | 0 | 1 | 19.83 | 18.65 | -45.77 | 63.50 | 0.7555 | |
| 0 | 1 | 0 | 1 | 21.94 | 17.11 | -47.32 | 61.48 | 0.7784 | |
| 0 | 4 | 0 | 3 | 21.51 | 16.78 | -47.66 | 62.13 | 0.7801 | |
| 0 | 1 | 0 | 1 | 22.46 | 15.87 | -48.55 | 61.31 | 0.7918 | |
| 0 | 1 | 0 | 1 | 25.50 | 12.96 | -51.47 | 58.78 | 0.8277 | |
| 0 | 1 | 0 | 1 | 22.61 | 14.79 | -49.63 | 61.52 | 0.8023 | |
| 2 | 39 | 2 | 36 | 26.21 | 11.33 | -53.11 | 58.54 | 0.8433 | |
| 5 | 64 | 4 | 55 | 23.62 | 13.45 | -50.98 | 60.80 | 0.8177 | |
| 0 | 9 | 0 | 8 | 24.15 | 12.85 | -51.57 | 60.38 | 0.8244 | |
| 0 | 3 | 0 | 2 | 26.57 | 10.29 | -54.14 | 58.47 | 0.8525 | |
| 0 | 1 | 0 | 1 | 21.56 | 14.83 | -49.59 | 62.76 | 0.7987 | |
| 0 | 1 | 0 | 1 | 25.99 | 10.62 | -53.82 | 59.02 | 0.8483 | |
| 0 | 2 | 0 | 2 | 22.53 | 13.89 | -50.53 | 61.92 | 0.8104 | |
| 1 | -30 | 1 | -30 | 22.98 | 13.07 | -51.34 | 61.67 | 0.8189 | |
| 0 | 1 | 0 | 1 | 21.85 | 13.68 | -50.75 | 62.80 | 0.8103 | |
| 1 | 113 | 1 | 106 | 24.16 | 11.18 | -53.25 | 60.91 | 0.8386 | |
| 2 | -38 | 2 | -38 | 24.42 | 10.68 | -53.74 | 60.78 | 0.8434 | |
| 1 | 16 | 1 | 14 | 23.37 | 11.58 | -52.86 | 61.70 | 0.8332 | |
| 9 | -38 | 8 | -38 | 24.97 | 9.95 | -54.49 | 60.38 | 0.8509 | |
| 1 | -38 | 1 | -38 | 25.55 | 9.16 | -55.26 | 59.95 | 0.8585 | |
| 0 | 2 | 0 | 2 | 23.22 | 9.20 | -55.22 | 62.57 | 0.8524 | |
| Proj. U | - Projected umbra area in millionths of solar disc, negative values indicate | |
|
that the umbra consists of fragmented regions which cannot be separated without losing umbral area. In this way several spots (intensity minima in the umbra) have a common umbra, e.g. -2 means that the given spot shares an umbra with spot No.2, and the common U value is indicated at spot No.2. |
||
| Proj. WS | - Projected whole spot area in millionths of solar disc, negative values indicate | |
|
that several umbras have a common penumbra, e.g. -7 means that the given umbra shares a penumbra with umbra No.7, and the WS value is indicated at No.7. |
||
| Corr. U | - Corrected umbra area in millionths of solar hemisphere, for negative values see above | |
| Corr. WS | - Corrected whole spot area in millionths of solar hemisphere, for negative values see above | |
| B | - Heliographic latitude B; positive: North, negative: South | |
| L | - Heliographic longitude L | |
| LCM | - Longitudinal distance from the Sun's central meridian | |
| Pos. angle | - Position angle | |
| r | - Distance from the centre of Sun's disc in terms of Sun's radius | |