Gyula 2000-06-15 06:47:54 UT
| group | Proj. U | Proj. WS | Corr. U | Corr. WS | B | L | LCM | Pos. angle | r |
| 125 | 940 | 100 | 764 | 21.17 | 284.52 | -49.60 | 63.67 | 0.7921 | |
|
previous
or next day for the same group /
back to the solar disc Gyula 2000-06-15 06:47:54 UT |
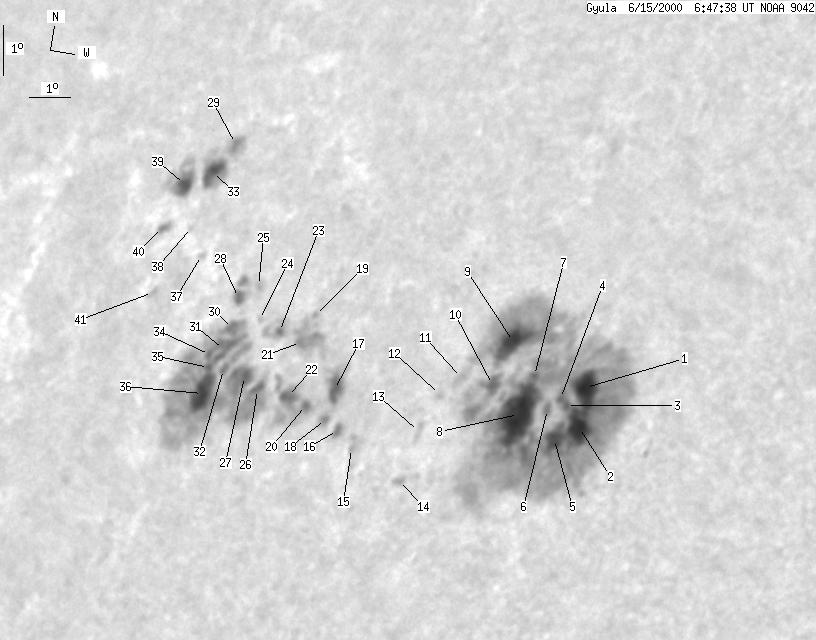
| spot | Proj. U | Proj. WS | Corr. U | Corr. WS | B | L | LCM | Pos. angle | r |
| 27 | 598 | 20 | 456 | 21.55 | 288.56 | -45.56 | 61.88 | 0.7552 | |
| -1 | -1 | -1 | -1 | 20.88 | 288.89 | -45.23 | 62.60 | 0.7494 | |
| 0 | -1 | 0 | -1 | 21.20 | 288.32 | -45.80 | 62.41 | 0.7563 | |
| 0 | -1 | 0 | -1 | 21.31 | 288.19 | -45.93 | 62.32 | 0.7581 | |
| 4 | -1 | 3 | -1 | 20.61 | 288.46 | -45.66 | 63.12 | 0.7528 | |
| 1 | -1 | 0 | -1 | 21.08 | 287.93 | -46.18 | 62.71 | 0.7598 | |
| 0 | -1 | 0 | -1 | 21.59 | 287.28 | -46.84 | 62.32 | 0.7682 | |
| 34 | -1 | 26 | -1 | 20.92 | 287.40 | -46.71 | 63.11 | 0.7646 | |
| 12 | -1 | 9 | -1 | 22.11 | 286.45 | -47.66 | 61.98 | 0.7780 | |
| 2 | -1 | 2 | -1 | 21.32 | 286.48 | -47.63 | 62.95 | 0.7750 | |
| 0 | 4 | 0 | 3 | 21.34 | 285.61 | -48.51 | 63.23 | 0.7837 | |
| 0 | 1 | 0 | 1 | 21.00 | 285.28 | -48.83 | 63.75 | 0.7858 | |
| 0 | 4 | 0 | 3 | 20.34 | 285.20 | -48.92 | 64.59 | 0.7847 | |
| 0 | 2 | 0 | 2 | 19.50 | 285.28 | -48.84 | 65.60 | 0.7815 | |
| 0 | 3 | 0 | 2 | 19.83 | 283.80 | -50.31 | 65.64 | 0.7968 | |
| 1 | 3 | 1 | 2 | 20.08 | 283.21 | -50.90 | 65.51 | 0.8031 | |
| 4 | 58 | 3 | 49 | 20.77 | 282.68 | -51.43 | 64.84 | 0.8098 | |
| 1 | -17 | 0 | -17 | 20.23 | 282.80 | -51.31 | 65.46 | 0.8074 | |
| 0 | 1 | 0 | 1 | 21.90 | 281.26 | -52.85 | 63.91 | 0.8256 | |
| 1 | -17 | 1 | -17 | 20.40 | 282.14 | -51.97 | 65.44 | 0.8140 | |
| 0 | 19 | 0 | 17 | 21.42 | 281.23 | -52.89 | 64.49 | 0.8247 | |
| 3 | -17 | 2 | -17 | 20.49 | 281.59 | -52.53 | 65.48 | 0.8193 | |
| 1 | 6 | 1 | 5 | 21.53 | 280.54 | -53.58 | 64.54 | 0.8311 | |
| 0 | 1 | 0 | 1 | 21.66 | 279.85 | -54.26 | 64.57 | 0.8374 | |
| 0 | 1 | 0 | 1 | 22.22 | 279.32 | -54.80 | 64.06 | 0.8432 | |
| 2 | 190 | 2 | 171 | 20.50 | 280.66 | -53.45 | 65.71 | 0.8276 | |
| 2 | -26 | 2 | -26 | 20.67 | 280.18 | -53.94 | 65.65 | 0.8323 | |
| 1 | 8 | 1 | 8 | 21.95 | 278.93 | -55.19 | 64.48 | 0.8459 | |
| 0 | 5 | 0 | 5 | 24.52 | 276.49 | -57.62 | 62.17 | 0.8708 | |
| 2 | -26 | 2 | -26 | 21.43 | 279.25 | -54.86 | 64.99 | 0.8421 | |
| 4 | -26 | 4 | -26 | 20.98 | 279.29 | -54.82 | 65.51 | 0.8407 | |
| 1 | -26 | 0 | -26 | 20.73 | 279.56 | -54.55 | 65.73 | 0.8379 | |
| 5 | 16 | 5 | 16 | 23.96 | 276.32 | -57.79 | 62.84 | 0.8710 | |
| 1 | -26 | 1 | -26 | 20.91 | 278.98 | -55.13 | 65.67 | 0.8433 | |
| 0 | -26 | 0 | -26 | 20.69 | 279.12 | -55.00 | 65.88 | 0.8416 | |
| 13 | -26 | 12 | -26 | 20.32 | 279.30 | -54.82 | 66.28 | 0.8393 | |
| 0 | 0 | 0 | 0 | 22.52 | 277.33 | -56.79 | 64.22 | 0.8603 | |
| 0 | 0 | 0 | 0 | 22.94 | 276.60 | -57.51 | 63.92 | 0.8669 | |
| 3 | 17 | 3 | 18 | 23.60 | 275.66 | -58.45 | 63.40 | 0.8753 | |
| 0 | 2 | 0 | 2 | 22.85 | 275.69 | -58.42 | 64.23 | 0.8737 | |
| 0 | 1 | 0 | 1 | 21.76 | 276.50 | -57.62 | 65.27 | 0.8655 | |
| Proj. U | - Projected umbra area in millionths of solar disc, negative values indicate | |
|
that the umbra consists of fragmented regions which cannot be separated without losing umbral area. In this way several spots (intensity minima in the umbra) have a common umbra, e.g. -2 means that the given spot shares an umbra with spot No.2, and the common U value is indicated at spot No.2. |
||
| Proj. WS | - Projected whole spot area in millionths of solar disc, negative values indicate | |
|
that several umbras have a common penumbra, e.g. -7 means that the given umbra shares a penumbra with umbra No.7, and the WS value is indicated at No.7. |
||
| Corr. U | - Corrected umbra area in millionths of solar hemisphere, for negative values see above | |
| Corr. WS | - Corrected whole spot area in millionths of solar hemisphere, for negative values see above | |
| B | - Heliographic latitude B; positive: North, negative: South | |
| L | - Heliographic longitude L | |
| LCM | - Longitudinal distance from the Sun's central meridian | |
| Pos. angle | - Position angle | |
| r | - Distance from the centre of Sun's disc in terms of Sun's radius | |