Gyula 2000-06-16 10:16:40 UT
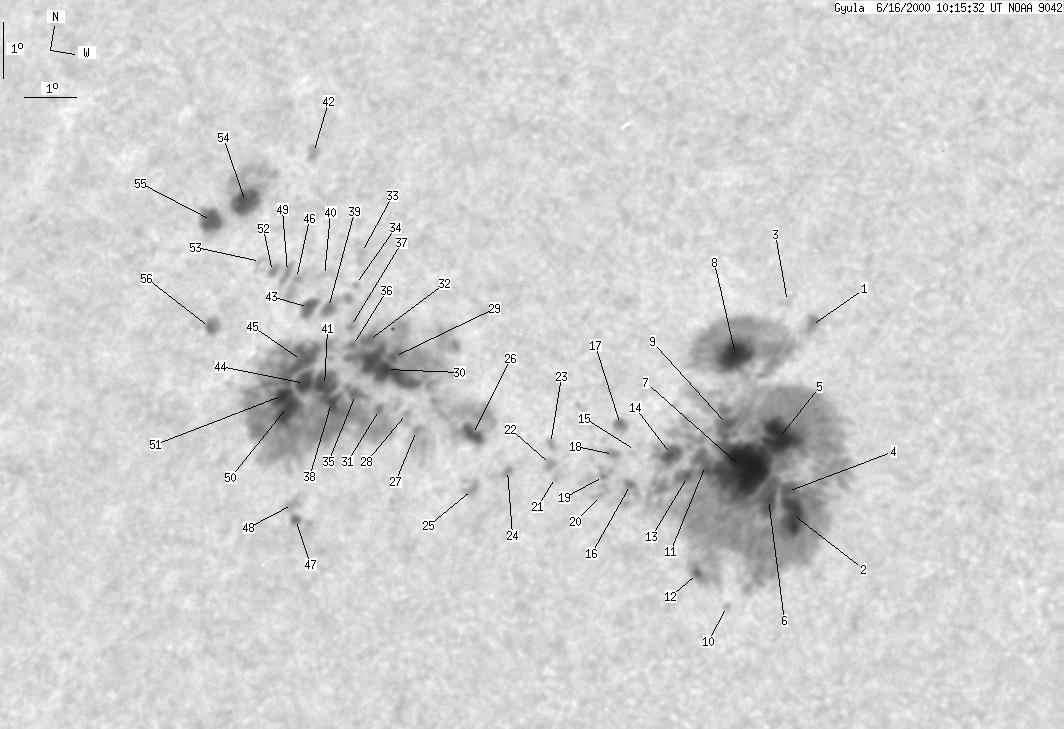
| group | Proj. U | Proj. WS | Corr. U | Corr. WS | B | L | LCM | Pos. angle | r |
| 195 | 1552 | 125 | 996 | 21.42 | 284.41 | -34.55 | 56.28 | 0.6341 | |
|
previous
or next day for the same group /
back to the solar disc Gyula 2000-06-16 10:16:40 UT |
| spot | Proj. U | Proj. WS | Corr. U | Corr. WS | B | L | LCM | Pos. angle | r |
| 0 | 8 | 0 | 5 | 23.58 | 288.36 | -30.60 | 50.61 | 0.6059 | |
| 13 | 908 | 8 | 557 | 20.38 | 289.33 | -29.63 | 54.50 | 0.5714 | |
| 0 | 3 | 0 | 2 | 23.89 | 287.67 | -31.29 | 50.75 | 0.6155 | |
| 3 | -2 | 2 | -2 | 20.78 | 289.04 | -29.93 | 54.13 | 0.5778 | |
| 69 | -2 | 42 | -2 | 21.57 | 288.54 | -30.42 | 53.35 | 0.5891 | |
| 5 | -2 | 3 | -2 | 20.58 | 288.77 | -30.18 | 54.64 | 0.5793 | |
| -5 | -2 | -5 | -2 | 21.01 | 288.11 | -30.84 | 54.51 | 0.5900 | |
| 14 | -2 | 9 | -2 | 22.82 | 287.11 | -31.85 | 52.67 | 0.6139 | |
| 1 | -2 | 1 | -2 | 21.69 | 287.45 | -31.51 | 54.03 | 0.6023 | |
| 0 | 1 | 0 | 1 | 18.75 | 288.67 | -30.29 | 57.54 | 0.5682 | |
| 7 | -2 | 5 | -2 | 20.88 | 287.37 | -31.59 | 55.28 | 0.5977 | |
| 1 | -2 | 1 | -2 | 19.20 | 287.97 | -31.00 | 57.36 | 0.5797 | |
| 1 | -2 | 1 | -2 | 20.74 | 287.08 | -31.88 | 55.70 | 0.6001 | |
| 3 | -2 | 2 | -2 | 21.03 | 286.64 | -32.32 | 55.59 | 0.6071 | |
| 0 | 3 | 0 | 2 | 21.00 | 285.93 | -33.03 | 56.14 | 0.6151 | |
| 1 | -2 | 1 | -2 | 20.39 | 286.10 | -32.85 | 56.90 | 0.6092 | |
| 1 | 7 | 1 | 4 | 21.32 | 285.46 | -33.49 | 56.00 | 0.6223 | |
| 0 | 2 | 0 | 1 | 20.88 | 285.56 | -33.41 | 56.58 | 0.6186 | |
| 0 | 3 | 0 | 2 | 20.46 | 285.57 | -33.38 | 57.17 | 0.6157 | |
| 0 | 3 | 0 | 2 | 20.17 | 285.61 | -33.36 | 57.57 | 0.6137 | |
| 0 | 1 | 0 | 1 | 20.38 | 284.66 | -34.30 | 57.89 | 0.6259 | |
| 0 | 2 | 0 | 1 | 20.51 | 284.49 | -34.47 | 57.80 | 0.6286 | |
| 0 | 1 | 0 | 1 | 20.87 | 284.31 | -34.65 | 57.41 | 0.6329 | |
| 0 | 2 | 0 | 2 | 20.29 | 283.64 | -35.31 | 58.66 | 0.6371 | |
| 0 | 3 | 0 | 2 | 19.92 | 283.14 | -35.82 | 59.49 | 0.6408 | |
| 3 | 483 | 2 | 328 | 20.78 | 282.70 | -36.25 | 58.52 | 0.6505 | |
| 0 | 11 | 0 | 7 | 20.70 | 281.59 | -37.37 | 59.28 | 0.6627 | |
| 0 | 2 | 0 | 2 | 20.93 | 281.28 | -37.69 | 59.14 | 0.6675 | |
| 1 | -26 | 1 | -26 | 21.84 | 280.48 | -38.47 | 58.33 | 0.6808 | |
| 19 | -26 | 13 | -26 | 21.59 | 280.49 | -38.47 | 58.66 | 0.6795 | |
| 1 | -26 | 0 | -26 | 20.92 | 280.65 | -38.32 | 59.50 | 0.6745 | |
| 2 | -26 | 1 | -26 | 22.00 | 279.83 | -39.14 | 58.46 | 0.6889 | |
| 0 | 8 | 0 | 5 | 23.42 | 278.87 | -40.10 | 57.10 | 0.7062 | |
| 0 | 1 | 0 | 0 | 22.88 | 279.06 | -39.91 | 57.71 | 0.7015 | |
| 2 | -26 | 1 | -26 | 21.09 | 280.08 | -38.89 | 59.57 | 0.6816 | |
| 1 | -26 | 1 | -26 | 21.88 | 279.55 | -39.42 | 58.79 | 0.6913 | |
| 0 | 2 | 0 | 1 | 22.18 | 279.34 | -39.61 | 58.48 | 0.6949 | |
| 2 | -26 | 1 | -26 | 20.89 | 279.55 | -39.41 | 60.10 | 0.6865 | |
| 1 | 8 | 0 | 6 | 22.43 | 278.73 | -40.23 | 58.47 | 0.7027 | |
| 0 | 3 | 0 | 2 | 22.93 | 278.32 | -40.65 | 58.02 | 0.7095 | |
| 5 | -26 | 3 | -26 | 21.13 | 279.33 | -39.63 | 59.89 | 0.6900 | |
| 0 | 3 | 0 | 2 | 24.94 | 276.85 | -42.11 | 56.19 | 0.7340 | |
| 3 | 8 | 2 | 6 | 22.38 | 278.32 | -40.63 | 58.74 | 0.7067 | |
| 3 | -26 | 2 | -26 | 21.10 | 278.92 | -40.03 | 60.14 | 0.6943 | |
| 6 | -26 | 4 | -26 | 21.53 | 278.67 | -40.29 | 59.69 | 0.6991 | |
| 0 | 5 | 0 | 3 | 22.77 | 277.84 | -41.12 | 58.47 | 0.7137 | |
| 1 | 2 | 0 | 1 | 18.91 | 279.90 | -39.07 | 62.67 | 0.6734 | |
| 0 | 2 | 0 | 1 | 19.13 | 279.68 | -39.29 | 62.46 | 0.6770 | |
| 0 | 3 | 0 | 2 | 22.87 | 277.57 | -41.39 | 58.47 | 0.7170 | |
| 11 | -26 | 8 | -26 | 20.68 | 278.77 | -40.19 | 60.78 | 0.6940 | |
| -50 | -26 | -50 | -26 | 20.85 | 278.59 | -40.37 | 60.64 | 0.6968 | |
| 0 | 2 | 0 | 1 | 22.84 | 277.24 | -41.71 | 58.67 | 0.7202 | |
| 0 | 1 | 0 | 1 | 22.97 | 276.86 | -42.10 | 58.69 | 0.7248 | |
| 7 | 41 | 5 | 30 | 23.90 | 275.87 | -43.09 | 57.97 | 0.7390 | |
| 7 | 16 | 5 | 12 | 23.47 | 275.30 | -43.65 | 58.77 | 0.7428 | |
| 1 | 4 | 0 | 3 | 21.77 | 276.37 | -42.58 | 60.47 | 0.7246 | |
| Proj. U | - Projected umbra area in millionths of solar disc, negative values indicate | |
|
that the umbra consists of fragmented regions which cannot be separated without losing umbral area. In this way several spots (intensity minima in the umbra) have a common umbra, e.g. -2 means that the given spot shares an umbra with spot No.2, and the common U value is indicated at spot No.2. |
||
| Proj. WS | - Projected whole spot area in millionths of solar disc, negative values indicate | |
|
that several umbras have a common penumbra, e.g. -7 means that the given umbra shares a penumbra with umbra No.7, and the WS value is indicated at No.7. |
||
| Corr. U | - Corrected umbra area in millionths of solar hemisphere, for negative values see above | |
| Corr. WS | - Corrected whole spot area in millionths of solar hemisphere, for negative values see above | |
| B | - Heliographic latitude B; positive: North, negative: South | |
| L | - Heliographic longitude L | |
| LCM | - Longitudinal distance from the Sun's central meridian | |
| Pos. angle | - Position angle | |
| r | - Distance from the centre of Sun's disc in terms of Sun's radius | |