Gyula 2000-06-18 15:05:23 UT
| group | Proj. U | Proj. WS | Corr. U | Corr. WS | B | L | LCM | Pos. angle | r |
| 164 | 1520 | 105 | 973 | 19.92 | 254.64 | -35.19 | 59.39 | 0.6315 | |
|
previous
or next day for the same group /
back to the solar disc Gyula 2000-06-18 15:05:23 UT |
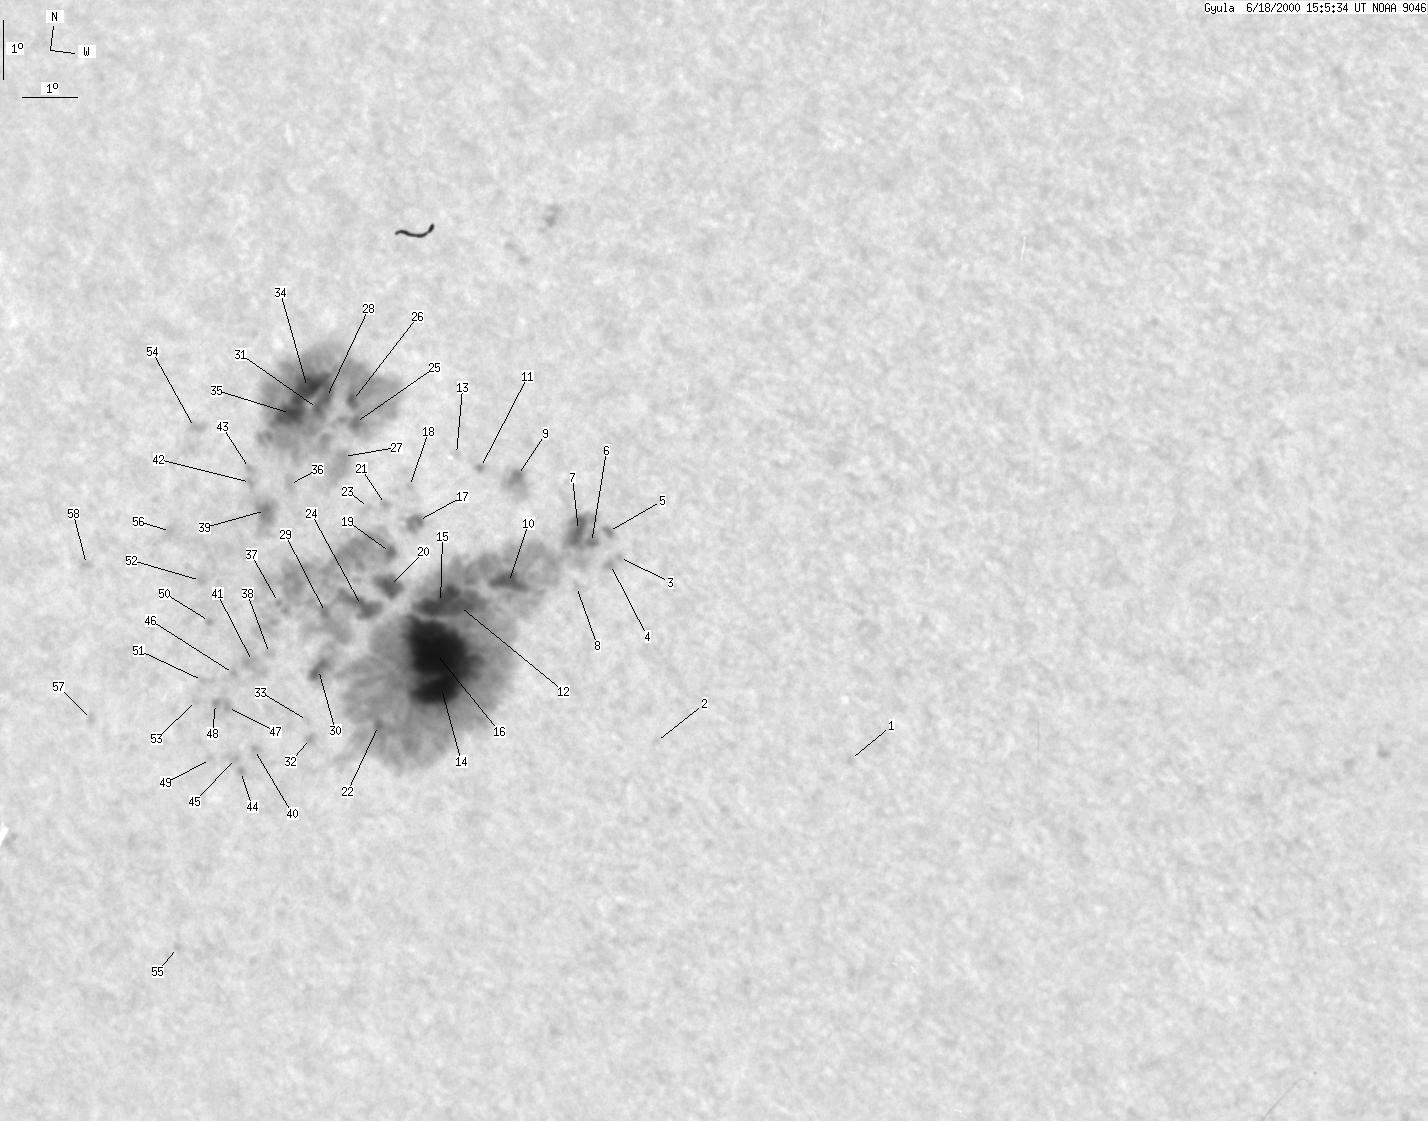
| spot | Proj. U | Proj. WS | Corr. U | Corr. WS | B | L | LCM | Pos. angle | r |
| 0 | 2 | 0 | 1 | 18.45 | 263.88 | -25.95 | 54.67 | 0.5108 | |
| 0 | 1 | 0 | 1 | 18.22 | 260.33 | -29.50 | 58.10 | 0.5530 | |
| 0 | 1 | 0 | 1 | 21.08 | 258.49 | -31.33 | 55.08 | 0.5940 | |
| 0 | 2 | 0 | 1 | 20.97 | 258.34 | -31.48 | 55.36 | 0.5950 | |
| 1 | 1144 | 0 | 718 | 21.43 | 258.11 | -31.72 | 54.85 | 0.6008 | |
| 1 | -5 | 1 | -5 | 21.25 | 257.86 | -31.97 | 55.30 | 0.6024 | |
| 5 | -5 | 3 | -5 | 21.39 | 257.54 | -32.29 | 55.33 | 0.6070 | |
| 0 | 1 | 0 | 0 | 20.49 | 257.89 | -31.94 | 56.40 | 0.5971 | |
| 1 | 20 | 1 | 13 | 22.06 | 255.95 | -33.88 | 55.47 | 0.6293 | |
| 8 | -5 | 5 | -5 | 20.38 | 256.59 | -33.23 | 57.47 | 0.6116 | |
| 0 | 1 | 0 | 1 | 22.12 | 255.23 | -34.60 | 55.87 | 0.6377 | |
| 6 | -5 | 4 | -5 | 19.82 | 255.74 | -34.09 | 58.86 | 0.6183 | |
| 0 | 1 | 0 | 1 | 22.25 | 254.64 | -35.19 | 56.07 | 0.6451 | |
| 83 | -5 | 52 | -5 | 18.47 | 256.01 | -33.81 | 60.70 | 0.6075 | |
| 11 | -5 | 7 | -5 | 19.88 | 255.45 | -34.38 | 58.94 | 0.6221 | |
| -14 | -5 | -14 | -5 | 19.01 | 255.69 | -34.14 | 60.10 | 0.6144 | |
| 1 | 6 | 0 | 4 | 21.09 | 254.34 | -35.48 | 57.89 | 0.6417 | |
| 0 | 1 | 0 | 1 | 21.64 | 253.99 | -35.84 | 57.33 | 0.6488 | |
| 1 | -5 | 1 | -5 | 20.52 | 254.09 | -35.73 | 58.85 | 0.6414 | |
| 6 | -5 | 4 | -5 | 19.95 | 254.32 | -35.51 | 59.54 | 0.6357 | |
| 0 | 2 | 0 | 1 | 21.29 | 253.61 | -36.22 | 58.04 | 0.6511 | |
| 1 | -5 | 1 | -5 | 17.70 | 255.05 | -34.78 | 62.44 | 0.6152 | |
| 0 | 2 | 0 | 1 | 21.20 | 253.28 | -36.55 | 58.37 | 0.6544 | |
| 6 | -5 | 4 | -5 | 19.58 | 253.92 | -35.90 | 60.30 | 0.6383 | |
| 1 | 249 | 1 | 169 | 22.54 | 252.37 | -37.46 | 57.05 | 0.6717 | |
| 2 | -25 | 1 | -25 | 22.92 | 252.09 | -37.73 | 56.70 | 0.6767 | |
| 0 | 13 | 0 | 9 | 21.91 | 252.45 | -37.38 | 57.87 | 0.6674 | |
| 1 | -25 | 1 | -25 | 22.88 | 251.55 | -38.28 | 57.05 | 0.6824 | |
| 2 | -5 | 1 | -5 | 19.38 | 253.25 | -36.58 | 60.96 | 0.6452 | |
| 3 | -5 | 2 | -5 | 18.41 | 253.55 | -36.28 | 62.23 | 0.6369 | |
| 1 | -25 | 1 | -25 | 22.69 | 251.47 | -38.36 | 57.36 | 0.6823 | |
| 0 | 1 | 0 | 1 | 17.29 | 253.87 | -35.96 | 63.71 | 0.6276 | |
| 0 | 2 | 0 | 2 | 17.61 | 253.70 | -36.12 | 63.32 | 0.6311 | |
| 21 | -25 | 14 | -25 | 23.02 | 251.11 | -38.71 | 57.12 | 0.6878 | |
| -34 | -25 | -34 | -25 | 22.50 | 250.97 | -38.86 | 57.88 | 0.6867 | |
| 0 | 5 | 0 | 3 | 21.38 | 251.53 | -38.30 | 59.11 | 0.6749 | |
| 1 | -5 | 1 | -5 | 19.41 | 252.28 | -37.55 | 61.46 | 0.6567 | |
| 0 | 2 | 0 | 2 | 18.57 | 252.49 | -37.33 | 62.55 | 0.6501 | |
| 1 | 18 | 0 | 12 | 20.83 | 251.28 | -38.55 | 59.99 | 0.6749 | |
| 0 | 1 | 0 | 1 | 16.98 | 252.91 | -36.92 | 64.66 | 0.6379 | |
| 0 | 16 | 0 | 10 | 18.38 | 252.22 | -37.61 | 62.96 | 0.6525 | |
| 0 | 2 | 0 | 2 | 21.28 | 250.69 | -39.14 | 59.69 | 0.6836 | |
| 0 | 2 | 0 | 2 | 21.50 | 250.59 | -39.24 | 59.44 | 0.6858 | |
| 0 | 2 | 0 | 1 | 16.61 | 252.76 | -37.07 | 65.29 | 0.6381 | |
| 0 | 1 | 0 | 1 | 16.84 | 252.56 | -37.27 | 65.04 | 0.6416 | |
| 0 | 2 | 0 | 1 | 18.15 | 251.93 | -37.90 | 63.44 | 0.6549 | |
| 0 | 2 | 0 | 1 | 17.60 | 252.04 | -37.79 | 64.18 | 0.6511 | |
| 0 | 2 | 0 | 1 | 17.62 | 251.79 | -38.04 | 64.26 | 0.6542 | |
| 0 | 2 | 0 | 1 | 16.74 | 252.08 | -37.74 | 65.42 | 0.6469 | |
| 0 | 1 | 0 | 1 | 18.90 | 251.05 | -38.78 | 62.79 | 0.6685 | |
| 0 | 2 | 0 | 1 | 17.95 | 251.44 | -38.39 | 63.96 | 0.6599 | |
| 0 | 1 | 0 | 1 | 19.50 | 250.55 | -39.28 | 62.19 | 0.6769 | |
| 0 | 2 | 0 | 1 | 17.60 | 251.42 | -38.41 | 64.47 | 0.6586 | |
| 0 | 3 | 0 | 2 | 21.98 | 249.21 | -40.62 | 59.48 | 0.7030 | |
| 0 | 1 | 0 | 1 | 13.68 | 252.64 | -37.19 | 69.78 | 0.6281 | |
| 0 | 2 | 0 | 1 | 20.25 | 249.57 | -40.26 | 61.63 | 0.6913 | |
| 0 | 1 | 0 | 1 | 17.02 | 249.42 | -40.41 | 66.17 | 0.6799 | |
| 0 | 1 | 0 | 1 | 19.46 | 248.10 | -41.73 | 63.36 | 0.7044 | |
| Proj. U | - Projected umbra area in millionths of solar disc, negative values indicate | |
|
that the umbra consists of fragmented regions which cannot be separated without losing umbral area. In this way several spots (intensity minima in the umbra) have a common umbra, e.g. -2 means that the given spot shares an umbra with spot No.2, and the common U value is indicated at spot No.2. |
||
| Proj. WS | - Projected whole spot area in millionths of solar disc, negative values indicate | |
|
that several umbras have a common penumbra, e.g. -7 means that the given umbra shares a penumbra with umbra No.7, and the WS value is indicated at No.7. |
||
| Corr. U | - Corrected umbra area in millionths of solar hemisphere, for negative values see above | |
| Corr. WS | - Corrected whole spot area in millionths of solar hemisphere, for negative values see above | |
| B | - Heliographic latitude B; positive: North, negative: South | |
| L | - Heliographic longitude L | |
| LCM | - Longitudinal distance from the Sun's central meridian | |
| Pos. angle | - Position angle | |
| r | - Distance from the centre of Sun's disc in terms of Sun's radius | |