Gyula 2000-08-28 06:37:11 UT
| group | Proj. U | Proj. WS | Corr. U | Corr. WS | B | L | LCM | Pos. angle | r |
| 109 | 802 | 71 | 518 | -18.15 | 45.23 | -30.12 | 130.96 | 0.6327 | |
|
previous
or next day for the same group /
back to the solar disc Gyula 2000-08-28 06:37:11 UT |
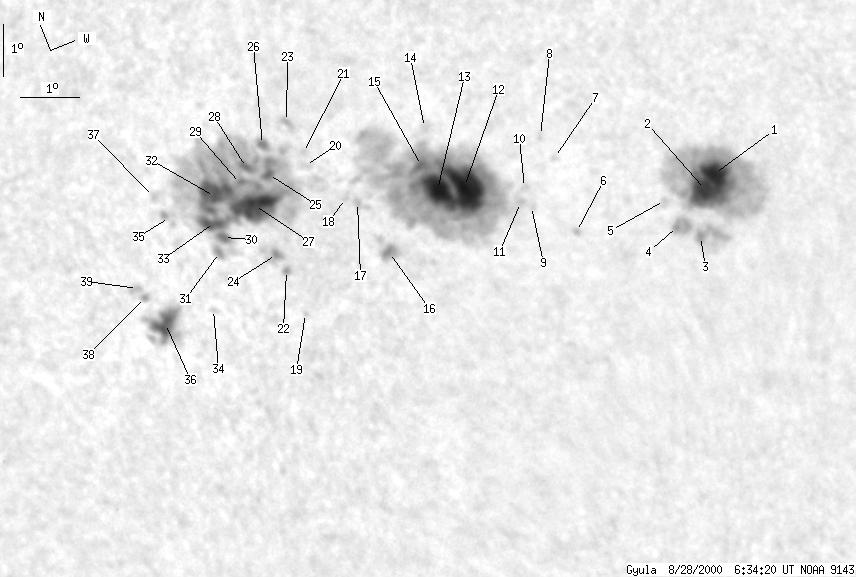
| spot | Proj. U | Proj. WS | Corr. U | Corr. WS | B | L | LCM | Pos. angle | r |
| 19 | 201 | 12 | 124 | -19.15 | 50.29 | -25.08 | 137.15 | 0.5911 | |
| -1 | -1 | -1 | -1 | -19.39 | 50.13 | -25.21 | 137.30 | 0.5947 | |
| 1 | -1 | 0 | -1 | -20.15 | 49.51 | -25.86 | 137.49 | 0.6082 | |
| 1 | -1 | 1 | -1 | -19.84 | 49.20 | -26.17 | 136.78 | 0.6081 | |
| 0 | 1 | 0 | 1 | -19.39 | 49.26 | -26.08 | 136.33 | 0.6029 | |
| 0 | 1 | 0 | 1 | -19.43 | 47.55 | -27.79 | 134.61 | 0.6198 | |
| 0 | 1 | 0 | 1 | -18.06 | 47.86 | -27.51 | 133.20 | 0.6046 | |
| 0 | 1 | 0 | 1 | -17.66 | 47.84 | -27.53 | 132.66 | 0.6011 | |
| 0 | 1 | 0 | 1 | -18.76 | 47.05 | -28.32 | 133.26 | 0.6189 | |
| 0 | 1 | 0 | 1 | -18.43 | 47.13 | -28.21 | 132.95 | 0.6149 | |
| 0 | 1 | 0 | 1 | -18.63 | 46.88 | -28.49 | 132.92 | 0.6195 | |
| 19 | 249 | 12 | 158 | -18.16 | 46.20 | -29.14 | 131.70 | 0.6220 | |
| 10 | -12 | 7 | -12 | -18.05 | 45.73 | -29.61 | 131.11 | 0.6258 | |
| 0 | 2 | 0 | 1 | -16.94 | 46.08 | -29.27 | 130.01 | 0.6128 | |
| 2 | -12 | 1 | -12 | -17.55 | 45.71 | -29.64 | 130.45 | 0.6218 | |
| 2 | 12 | 2 | 8 | -18.82 | 44.31 | -31.03 | 130.77 | 0.6466 | |
| 0 | 1 | 0 | 1 | -17.91 | 44.32 | -31.03 | 129.64 | 0.6391 | |
| 0 | 1 | 0 | 1 | -17.69 | 44.02 | -31.34 | 129.09 | 0.6407 | |
| 0 | 0 | 0 | 0 | -19.41 | 42.15 | -33.22 | 129.61 | 0.6730 | |
| 0 | 2 | 0 | 2 | -16.96 | 43.68 | -31.69 | 127.85 | 0.6385 | |
| 0 | 1 | 0 | 1 | -16.78 | 43.85 | -31.49 | 127.79 | 0.6351 | |
| 0 | 1 | 0 | 1 | -18.64 | 42.37 | -32.97 | 128.88 | 0.6648 | |
| 0 | 1 | 0 | 1 | -16.17 | 43.86 | -31.48 | 127.00 | 0.6303 | |
| 1 | 10 | 0 | 6 | -18.32 | 42.34 | -33.00 | 128.46 | 0.6626 | |
| 1 | 267 | 1 | 175 | -16.92 | 43.00 | -32.37 | 127.22 | 0.6455 | |
| 1 | -25 | 1 | -25 | -16.43 | 43.21 | -32.13 | 126.79 | 0.6392 | |
| 16 | -25 | 10 | -25 | -17.39 | 42.53 | -32.81 | 127.45 | 0.6536 | |
| 2 | -25 | 1 | -25 | -16.71 | 42.73 | -32.61 | 126.75 | 0.6465 | |
| 1 | -25 | 1 | -25 | -16.94 | 42.40 | -32.96 | 126.75 | 0.6519 | |
| 2 | -25 | 1 | -25 | -17.74 | 41.55 | -33.81 | 127.08 | 0.6667 | |
| 2 | -25 | 1 | -25 | -17.98 | 41.33 | -34.03 | 127.20 | 0.6706 | |
| 13 | -25 | 9 | -25 | -17.02 | 41.93 | -33.42 | 126.49 | 0.6573 | |
| 7 | -25 | 5 | -25 | -17.50 | 41.58 | -33.76 | 126.82 | 0.6643 | |
| 0 | 0 | 0 | 0 | -18.89 | 40.60 | -34.77 | 127.75 | 0.6847 | |
| 0 | 5 | 0 | 3 | -17.16 | 40.90 | -34.44 | 125.85 | 0.6691 | |
| 9 | 38 | 6 | 26 | -18.92 | 39.69 | -35.65 | 127.11 | 0.6937 | |
| 0 | 1 | 0 | 1 | -16.75 | 40.81 | -34.55 | 125.25 | 0.6674 | |
| 0 | 1 | 0 | 1 | -18.43 | 39.60 | -35.75 | 126.44 | 0.6912 | |
| 0 | 2 | 0 | 1 | -18.21 | 39.54 | -35.81 | 126.13 | 0.6904 | |
| Proj. U | - Projected umbra area in millionths of solar disc, negative values indicate | |
|
that the umbra consists of fragmented regions which cannot be separated without losing umbral area. In this way several spots (intensity minima in the umbra) have a common umbra, e.g. -2 means that the given spot shares an umbra with spot No.2, and the common U value is indicated at spot No.2. |
||
| Proj. WS | - Projected whole spot area in millionths of solar disc, negative values indicate | |
|
that several umbras have a common penumbra, e.g. -7 means that the given umbra shares a penumbra with umbra No.7, and the WS value is indicated at No.7. |
||
| Corr. U | - Corrected umbra area in millionths of solar hemisphere, for negative values see above | |
| Corr. WS | - Corrected whole spot area in millionths of solar hemisphere, for negative values see above | |
| B | - Heliographic latitude B; positive: North, negative: South | |
| L | - Heliographic longitude L | |
| LCM | - Longitudinal distance from the Sun's central meridian | |
| Pos. angle | - Position angle | |
| r | - Distance from the centre of Sun's disc in terms of Sun's radius | |