Debrecen 2000-09-04 14:36:27 UT
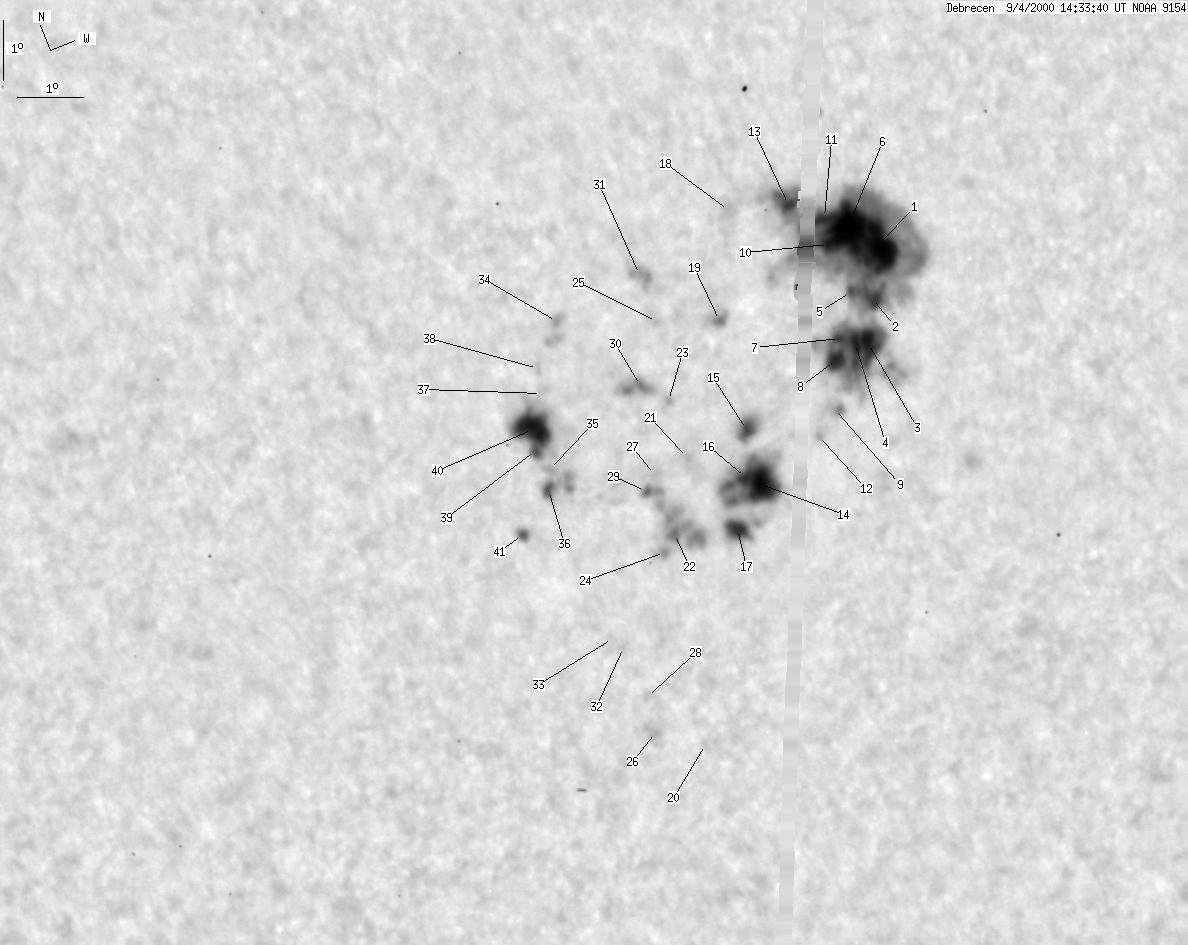
| group | Proj. U | Proj. WS | Corr. U | Corr. WS | B | L | LCM | Pos. angle | r |
| 116 | 620 | 65 | 350 | -17.98 | 329.03 | -9.45 | 159.98 | 0.4546 | |
|
previous
or next day for the same group /
back to the solar disc Debrecen 2000-09-04 14:36:27 UT |
| spot | Proj. U | Proj. WS | Corr. U | Corr. WS | B | L | LCM | Pos. angle | r |
| 22 | 400 | 12 | 220 | -17.12 | 330.94 | -7.54 | 163.05 | 0.4319 | |
| 3 | -1 | 2 | -1 | -17.87 | 330.61 | -7.87 | 162.88 | 0.4446 | |
| 7 | -1 | 4 | -1 | -18.54 | 330.24 | -8.24 | 162.59 | 0.4563 | |
| 2 | -1 | 1 | -1 | -18.47 | 330.04 | -8.45 | 162.15 | 0.4563 | |
| 1 | -1 | 1 | -1 | -17.69 | 330.28 | -8.24 | 162.00 | 0.4437 | |
| 31 | -1 | 17 | -1 | -16.69 | 330.60 | -7.89 | 162.00 | 0.4270 | |
| 1 | -1 | 1 | -1 | -18.34 | 329.85 | -8.67 | 161.62 | 0.4554 | |
| 5 | -1 | 3 | -1 | -18.60 | 329.71 | -8.77 | 161.60 | 0.4597 | |
| 0 | 7 | 0 | 4 | -19.41 | 329.36 | -9.12 | 161.51 | 0.4732 | |
| 2 | -1 | 1 | -1 | -16.86 | 330.25 | -8.26 | 161.35 | 0.4314 | |
| 5 | -1 | 3 | -1 | -16.39 | 330.35 | -8.13 | 161.25 | 0.4237 | |
| 0 | 1 | 0 | 1 | -19.72 | 328.94 | -9.54 | 160.94 | 0.4799 | |
| 2 | -1 | 1 | -1 | -16.02 | 329.94 | -8.54 | 160.05 | 0.4203 | |
| 12 | 55 | 7 | 31 | -20.22 | 327.75 | -10.73 | 159.16 | 0.4931 | |
| 2 | 9 | 1 | 5 | -19.22 | 327.93 | -10.56 | 158.69 | 0.4780 | |
| 2 | -14 | 1 | -14 | -20.02 | 327.57 | -10.94 | 158.63 | 0.4915 | |
| 4 | 15 | 2 | 9 | -20.74 | 327.10 | -11.38 | 158.43 | 0.5040 | |
| 0 | 3 | 0 | 2 | -15.76 | 329.00 | -9.48 | 157.84 | 0.4219 | |
| 0 | 3 | 0 | 2 | -17.42 | 328.17 | -10.31 | 157.64 | 0.4508 | |
| 0 | 1 | 0 | 1 | -24.11 | 325.10 | -13.41 | 157.73 | 0.5608 | |
| 0 | 1 | 0 | 1 | -19.37 | 326.88 | -11.64 | 156.87 | 0.4863 | |
| 1 | 30 | 0 | 17 | -20.50 | 326.17 | -12.32 | 156.65 | 0.5060 | |
| 0 | 1 | 0 | 1 | -18.35 | 326.97 | -11.51 | 156.20 | 0.4714 | |
| 0 | 1 | 0 | 1 | -20.75 | 325.88 | -12.60 | 156.37 | 0.5111 | |
| 0 | 1 | 0 | 0 | -17.14 | 327.30 | -11.21 | 155.64 | 0.4523 | |
| 0 | 3 | 0 | 2 | -23.63 | 324.46 | -14.06 | 156.41 | 0.5582 | |
| 0 | 1 | 0 | 0 | -19.50 | 326.27 | -12.24 | 155.92 | 0.4917 | |
| 0 | 1 | 0 | 1 | -23.00 | 324.59 | -13.92 | 156.13 | 0.5492 | |
| 0 | -22 | 0 | -22 | -19.69 | 325.99 | -12.49 | 155.65 | 0.4960 | |
| 0 | 11 | 0 | 6 | -18.00 | 326.61 | -11.87 | 155.23 | 0.4687 | |
| 0 | 12 | 0 | 7 | -16.27 | 327.35 | -11.13 | 154.95 | 0.4396 | |
| 0 | 2 | 0 | 1 | -22.06 | 324.59 | -13.92 | 155.36 | 0.5368 | |
| 0 | 1 | 0 | 1 | -21.88 | 324.50 | -14.01 | 155.06 | 0.5349 | |
| 0 | 8 | 0 | 5 | -16.55 | 325.87 | -12.61 | 152.40 | 0.4537 | |
| 0 | 1 | 0 | 1 | -18.87 | 324.76 | -13.74 | 152.75 | 0.4931 | |
| 1 | 10 | 1 | 6 | -19.13 | 324.64 | -13.84 | 152.84 | 0.4972 | |
| 0 | 1 | 0 | 1 | -17.63 | 325.21 | -13.31 | 152.26 | 0.4733 | |
| 0 | 1 | 0 | 1 | -17.21 | 325.28 | -13.23 | 151.97 | 0.4672 | |
| 1 | 37 | 1 | 21 | -18.45 | 324.72 | -13.76 | 152.32 | 0.4876 | |
| 11 | -39 | 6 | -39 | -18.13 | 324.83 | -13.65 | 152.17 | 0.4825 | |
| 1 | 3 | 0 | 2 | -19.74 | 323.94 | -14.55 | 152.28 | 0.5103 | |
| Proj. U | - Projected umbra area in millionths of solar disc, negative values indicate | |
|
that the umbra consists of fragmented regions which cannot be separated without losing umbral area. In this way several spots (intensity minima in the umbra) have a common umbra, e.g. -2 means that the given spot shares an umbra with spot No.2, and the common U value is indicated at spot No.2. |
||
| Proj. WS | - Projected whole spot area in millionths of solar disc, negative values indicate | |
|
that several umbras have a common penumbra, e.g. -7 means that the given umbra shares a penumbra with umbra No.7, and the WS value is indicated at No.7. |
||
| Corr. U | - Corrected umbra area in millionths of solar hemisphere, for negative values see above | |
| Corr. WS | - Corrected whole spot area in millionths of solar hemisphere, for negative values see above | |
| B | - Heliographic latitude B; positive: North, negative: South | |
| L | - Heliographic longitude L | |
| LCM | - Longitudinal distance from the Sun's central meridian | |
| Pos. angle | - Position angle | |
| r | - Distance from the centre of Sun's disc in terms of Sun's radius | |