Debrecen 2000-09-05 07:25:27 UT
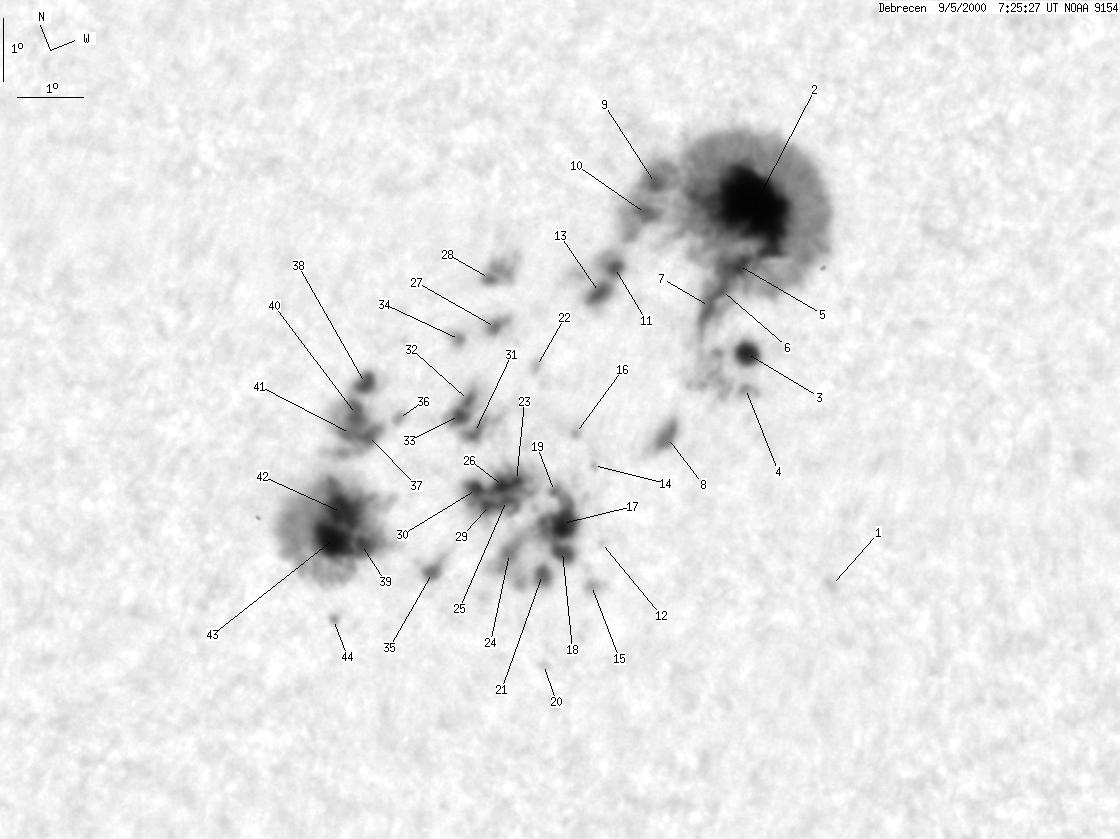
| group | Proj. U | Proj. WS | Corr. U | Corr. WS | B | L | LCM | Pos. angle | r |
| 228 | 1439 | 123 | 788 | -17.79 | 328.62 | -0.61 | 178.93 | 0.4279 | |
|
previous
or next day for the same group /
back to the solar disc Debrecen 2000-09-05 07:25:27 UT |
| spot | Proj. U | Proj. WS | Corr. U | Corr. WS | B | L | LCM | Pos. angle | r |
| 0 | 2 | 0 | 1 | -22.73 | 331.16 | 1.93 | 183.57 | 0.5024 | |
| 92 | 683 | 50 | 371 | -16.48 | 332.01 | 2.78 | 186.60 | 0.4066 | |
| 7 | -2 | 4 | -2 | -18.60 | 331.18 | 1.95 | 184.23 | 0.4388 | |
| 0 | 4 | 0 | 2 | -19.13 | 330.97 | 1.74 | 183.70 | 0.4469 | |
| 4 | -2 | 2 | -2 | -17.22 | 331.53 | 2.31 | 185.30 | 0.4174 | |
| 2 | -2 | 1 | -2 | -17.49 | 331.15 | 1.92 | 184.38 | 0.4213 | |
| 3 | -2 | 1 | -2 | -17.66 | 330.89 | 1.66 | 183.76 | 0.4238 | |
| 4 | 13 | 2 | 7 | -19.42 | 329.56 | 0.33 | 180.70 | 0.4506 | |
| 4 | -2 | 2 | -2 | -15.50 | 330.78 | 1.55 | 183.86 | 0.3891 | |
| 5 | -2 | 2 | -2 | -15.89 | 330.47 | 1.25 | 183.05 | 0.3950 | |
| 3 | -2 | 2 | -2 | -16.52 | 329.74 | 0.51 | 181.20 | 0.4047 | |
| 0 | 1 | 0 | 0 | -20.65 | 328.00 | -1.23 | 177.54 | 0.4701 | |
| 5 | -2 | 3 | -2 | -16.81 | 329.38 | 0.15 | 180.36 | 0.4093 | |
| 0 | 1 | 0 | 0 | -19.41 | 328.32 | -0.91 | 178.10 | 0.4506 | |
| 0 | 5 | 0 | 3 | -21.26 | 327.60 | -1.63 | 176.82 | 0.4799 | |
| 0 | 1 | 0 | 1 | -18.81 | 328.24 | -0.98 | 177.88 | 0.4413 | |
| 11 | 236 | 6 | 131 | -20.12 | 327.54 | -1.69 | 176.55 | 0.4623 | |
| 6 | -17 | 3 | -17 | -20.56 | 327.37 | -1.85 | 176.28 | 0.4692 | |
| 0 | -17 | 0 | -17 | -19.58 | 327.61 | -1.62 | 176.62 | 0.4538 | |
| 0 | 1 | 0 | 0 | -22.22 | 326.42 | -2.81 | 174.73 | 0.4958 | |
| 4 | -17 | 2 | -17 | -20.80 | 326.95 | -2.28 | 175.47 | 0.4734 | |
| 0 | 2 | 0 | 1 | -17.56 | 328.06 | -1.17 | 177.35 | 0.4217 | |
| 2 | -17 | 1 | -17 | -19.19 | 327.12 | -2.11 | 175.53 | 0.4482 | |
| 2 | -17 | 1 | -17 | -20.28 | 326.59 | -2.64 | 174.65 | 0.4658 | |
| 1 | -17 | 0 | -17 | -19.44 | 326.86 | -2.37 | 175.03 | 0.4524 | |
| 3 | -17 | 2 | -17 | -19.18 | 326.89 | -2.34 | 175.04 | 0.4484 | |
| 2 | 36 | 1 | 20 | -16.73 | 327.69 | -1.53 | 176.39 | 0.4088 | |
| 1 | 20 | 1 | 11 | -15.96 | 327.88 | -1.34 | 176.72 | 0.3963 | |
| 2 | -17 | 1 | -17 | -19.41 | 326.58 | -2.65 | 174.45 | 0.4525 | |
| 2 | -17 | 1 | -17 | -19.09 | 326.49 | -2.74 | 174.18 | 0.4476 | |
| 3 | 44 | 1 | 24 | -18.21 | 326.79 | -2.44 | 174.63 | 0.4333 | |
| 1 | -31 | 0 | -31 | -17.68 | 326.89 | -2.34 | 174.73 | 0.4249 | |
| 3 | -31 | 2 | -31 | -17.86 | 326.67 | -2.56 | 174.29 | 0.4280 | |
| 1 | -27 | 1 | -27 | -16.71 | 327.11 | -2.12 | 175.02 | 0.4091 | |
| 3 | 16 | 2 | 9 | -20.12 | 325.35 | -3.88 | 172.13 | 0.4656 | |
| 1 | 373 | 0 | 206 | -17.55 | 325.78 | -3.45 | 172.21 | 0.4249 | |
| 3 | -36 | 2 | -36 | -17.64 | 325.25 | -3.98 | 171.06 | 0.4274 | |
| 5 | -36 | 3 | -36 | -16.83 | 325.51 | -3.72 | 171.35 | 0.4141 | |
| 1 | -36 | 1 | -36 | -19.27 | 324.49 | -4.73 | 170.09 | 0.4546 | |
| 4 | -36 | 2 | -36 | -17.25 | 325.20 | -4.03 | 170.81 | 0.4215 | |
| 1 | -36 | 1 | -36 | -17.51 | 325.00 | -4.23 | 170.46 | 0.4260 | |
| 37 | -36 | 20 | -36 | -18.66 | 324.40 | -4.83 | 169.65 | 0.4455 | |
| -42 | -36 | -42 | -36 | -19.02 | 324.14 | -5.09 | 169.26 | 0.4518 | |
| 0 | 1 | 0 | 1 | -20.28 | 323.63 | -5.60 | 168.78 | 0.4724 | |
| Proj. U | - Projected umbra area in millionths of solar disc, negative values indicate | |
|
that the umbra consists of fragmented regions which cannot be separated without losing umbral area. In this way several spots (intensity minima in the umbra) have a common umbra, e.g. -2 means that the given spot shares an umbra with spot No.2, and the common U value is indicated at spot No.2. |
||
| Proj. WS | - Projected whole spot area in millionths of solar disc, negative values indicate | |
|
that several umbras have a common penumbra, e.g. -7 means that the given umbra shares a penumbra with umbra No.7, and the WS value is indicated at No.7. |
||
| Corr. U | - Corrected umbra area in millionths of solar hemisphere, for negative values see above | |
| Corr. WS | - Corrected whole spot area in millionths of solar hemisphere, for negative values see above | |
| B | - Heliographic latitude B; positive: North, negative: South | |
| L | - Heliographic longitude L | |
| LCM | - Longitudinal distance from the Sun's central meridian | |
| Pos. angle | - Position angle | |
| r | - Distance from the centre of Sun's disc in terms of Sun's radius | |