Gyula 2000-09-06 08:38:34 UT
| group | Proj. U | Proj. WS | Corr. U | Corr. WS | B | L | LCM | Pos. angle | r |
| 225 | 1475 | 128 | 835 | -17.86 | 329.35 | 13.99 | 208.51 | 0.4858 | |
|
previous
or next day for the same group /
back to the solar disc Gyula 2000-09-06 08:38:34 UT |
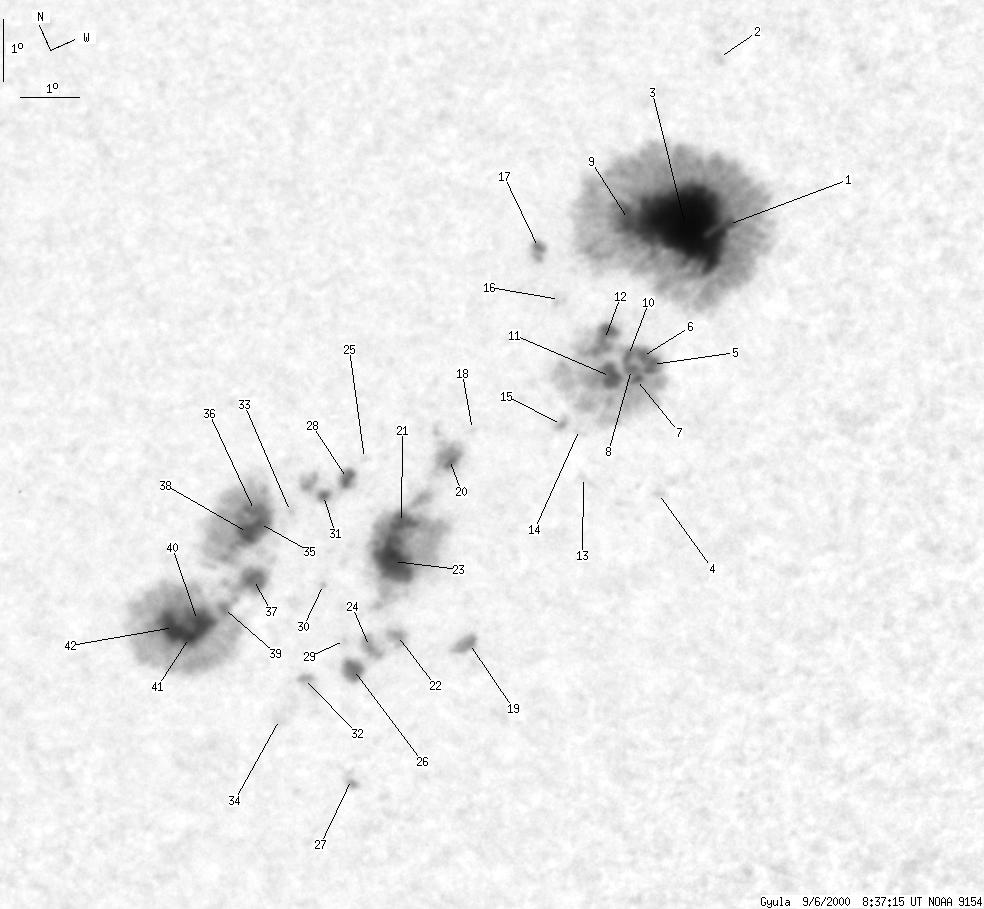
| spot | Proj. U | Proj. WS | Corr. U | Corr. WS | B | L | LCM | Pos. angle | r |
| 2 | 589 | 1 | 335 | -16.61 | 333.88 | 18.52 | 217.40 | 0.5032 | |
| 0 | 1 | 0 | 1 | -14.01 | 334.55 | 19.19 | 221.88 | 0.4797 | |
| 106 | -1 | 60 | -1 | -16.34 | 333.22 | 17.86 | 216.74 | 0.4940 | |
| 0 | 1 | 0 | 1 | -20.31 | 331.46 | 16.09 | 209.58 | 0.5287 | |
| 5 | 199 | 3 | 113 | -18.26 | 331.98 | 16.63 | 212.56 | 0.5070 | |
| -5 | -5 | -5 | -5 | -18.05 | 331.87 | 16.51 | 212.61 | 0.5035 | |
| 3 | -5 | 2 | -5 | -18.38 | 331.65 | 16.29 | 211.90 | 0.5058 | |
| -7 | -5 | -7 | -5 | -18.18 | 331.61 | 16.26 | 212.07 | 0.5031 | |
| 4 | -1 | 2 | -1 | -15.85 | 332.32 | 16.96 | 215.95 | 0.4800 | |
| 2 | -5 | 1 | -5 | -17.95 | 331.65 | 16.29 | 212.38 | 0.5004 | |
| 8 | -5 | 4 | -5 | -18.15 | 331.24 | 15.88 | 211.50 | 0.4997 | |
| 7 | -5 | 4 | -5 | -17.54 | 331.38 | 16.02 | 212.42 | 0.4930 | |
| 0 | 1 | 0 | 1 | -19.53 | 330.30 | 14.94 | 208.55 | 0.5103 | |
| 0 | 2 | 0 | 1 | -18.75 | 330.47 | 15.10 | 209.61 | 0.5013 | |
| 1 | 7 | 0 | 4 | -18.58 | 330.24 | 14.89 | 209.43 | 0.4976 | |
| 0 | 4 | 0 | 2 | -16.62 | 330.81 | 15.45 | 212.53 | 0.4767 | |
| 1 | 6 | 1 | 3 | -15.64 | 330.75 | 15.40 | 213.61 | 0.4637 | |
| 0 | 0 | 0 | 0 | -18.01 | 328.75 | 13.38 | 207.47 | 0.4791 | |
| 1 | 7 | 1 | 4 | -21.38 | 327.65 | 12.30 | 202.60 | 0.5181 | |
| 3 | 201 | 2 | 114 | -18.40 | 328.24 | 12.89 | 206.23 | 0.4810 | |
| 32 | -20 | 18 | -20 | -19.00 | 327.19 | 11.83 | 203.79 | 0.4826 | |
| 1 | 52 | 1 | 30 | -20.80 | 326.59 | 11.24 | 201.28 | 0.5041 | |
| -21 | -20 | -21 | -20 | -19.54 | 326.87 | 11.52 | 202.77 | 0.4882 | |
| 2 | -22 | 1 | -22 | -20.77 | 326.07 | 10.72 | 200.39 | 0.5009 | |
| 0 | 1 | 0 | 1 | -17.72 | 326.89 | 11.53 | 204.40 | 0.4627 | |
| 5 | -22 | 3 | -22 | -21.01 | 325.65 | 10.30 | 199.49 | 0.5022 | |
| 0 | 7 | 0 | 4 | -22.82 | 325.08 | 9.72 | 197.31 | 0.5251 | |
| 3 | 33 | 2 | 19 | -17.96 | 326.55 | 11.21 | 203.58 | 0.4641 | |
| 0 | 1 | 0 | 0 | -20.49 | 325.66 | 10.31 | 199.88 | 0.4948 | |
| 0 | 1 | 0 | 0 | -19.44 | 325.62 | 10.26 | 200.59 | 0.4797 | |
| 2 | -28 | 1 | -28 | -18.02 | 326.06 | 10.69 | 202.56 | 0.4618 | |
| 0 | 6 | 0 | 3 | -20.84 | 324.86 | 9.51 | 198.21 | 0.4959 | |
| 0 | 1 | 0 | 0 | -18.07 | 325.50 | 10.15 | 201.48 | 0.4595 | |
| 0 | 3 | 0 | 2 | -21.27 | 324.19 | 8.83 | 196.72 | 0.4991 | |
| 1 | 352 | 1 | 197 | -18.05 | 324.98 | 9.63 | 200.49 | 0.4562 | |
| 2 | -35 | 1 | -35 | -17.83 | 324.95 | 9.60 | 200.61 | 0.4528 | |
| 5 | -35 | 3 | -35 | -18.87 | 324.54 | 9.19 | 199.01 | 0.4658 | |
| 4 | -35 | 2 | -35 | -18.09 | 324.72 | 9.36 | 199.94 | 0.4554 | |
| 1 | -35 | 1 | -35 | -19.12 | 323.90 | 8.54 | 197.57 | 0.4664 | |
| 13 | -35 | 7 | -35 | -19.16 | 323.50 | 8.15 | 196.79 | 0.4652 | |
| 3 | -35 | 2 | -35 | -19.34 | 323.24 | 7.88 | 196.17 | 0.4667 | |
| 8 | -35 | 4 | -35 | -19.06 | 323.05 | 7.69 | 195.97 | 0.4618 | |
| Proj. U | - Projected umbra area in millionths of solar disc, negative values indicate | |
|
that the umbra consists of fragmented regions which cannot be separated without losing umbral area. In this way several spots (intensity minima in the umbra) have a common umbra, e.g. -2 means that the given spot shares an umbra with spot No.2, and the common U value is indicated at spot No.2. |
||
| Proj. WS | - Projected whole spot area in millionths of solar disc, negative values indicate | |
|
that several umbras have a common penumbra, e.g. -7 means that the given umbra shares a penumbra with umbra No.7, and the WS value is indicated at No.7. |
||
| Corr. U | - Corrected umbra area in millionths of solar hemisphere, for negative values see above | |
| Corr. WS | - Corrected whole spot area in millionths of solar hemisphere, for negative values see above | |
| B | - Heliographic latitude B; positive: North, negative: South | |
| L | - Heliographic longitude L | |
| LCM | - Longitudinal distance from the Sun's central meridian | |
| Pos. angle | - Position angle | |
| r | - Distance from the centre of Sun's disc in terms of Sun's radius | |