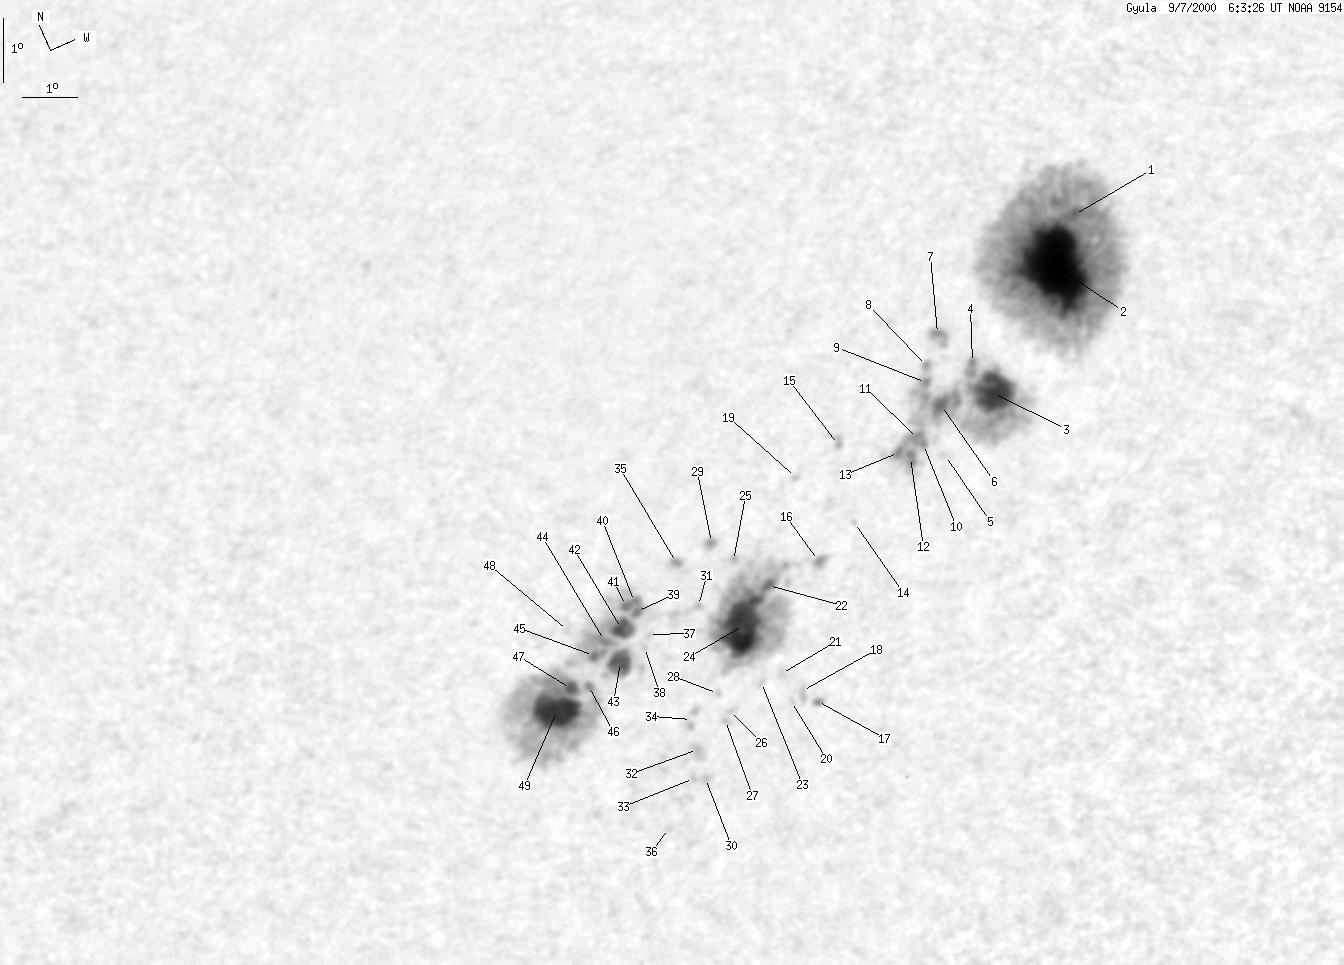
Gyula 2000-09-07 06:04:36 UT
| group | Proj. U | Proj. WS | Corr. U | Corr. WS | B | L | LCM | Pos. angle | r |
| 203 | 1204 | 125 | 737 | -17.77 | 329.91 | 26.36 | 225.52 | 0.5942 | |
|
previous
or next day for the same group /
back to the solar disc Gyula 2000-09-07 06:04:36 UT |
| spot | Proj. U | Proj. WS | Corr. U | Corr. WS | B | L | LCM | Pos. angle | r |
| 1 | 491 | 1 | 309 | -15.64 | 334.39 | 30.83 | 233.00 | 0.6202 | |
| 82 | -1 | 52 | -1 | -16.30 | 333.78 | 30.22 | 231.59 | 0.6189 | |
| 29 | 214 | 18 | 133 | -17.76 | 332.11 | 28.56 | 228.13 | 0.6136 | |
| 0 | -3 | 0 | -3 | -17.18 | 331.83 | 28.27 | 228.59 | 0.6056 | |
| 0 | 3 | 0 | 2 | -18.37 | 330.94 | 27.37 | 226.16 | 0.6072 | |
| 4 | -3 | 3 | -3 | -17.55 | 331.11 | 27.56 | 227.39 | 0.6016 | |
| 1 | 6 | 0 | 3 | -16.43 | 331.32 | 27.76 | 229.05 | 0.5937 | |
| 0 | -3 | 0 | -3 | -16.83 | 330.99 | 27.43 | 228.19 | 0.5938 | |
| 1 | -3 | 1 | -3 | -17.12 | 330.93 | 27.38 | 227.76 | 0.5959 | |
| 1 | -3 | 0 | -3 | -18.04 | 330.59 | 27.02 | 226.22 | 0.6006 | |
| 2 | -3 | 1 | -3 | -17.84 | 330.52 | 26.96 | 226.40 | 0.5982 | |
| 2 | -3 | 1 | -3 | -18.11 | 330.35 | 26.80 | 225.89 | 0.5990 | |
| 1 | -3 | 1 | -3 | -17.94 | 330.14 | 26.58 | 225.87 | 0.5953 | |
| 0 | 1 | 0 | 0 | -18.72 | 329.08 | 25.53 | 223.76 | 0.5923 | |
| 0 | 2 | 0 | 1 | -17.37 | 329.08 | 25.53 | 225.45 | 0.5794 | |
| 0 | 3 | 0 | 2 | -19.07 | 328.26 | 24.71 | 222.41 | 0.5879 | |
| 0 | 1 | 0 | 1 | -21.25 | 327.65 | 24.09 | 219.18 | 0.6045 | |
| 0 | 2 | 0 | 1 | -21.02 | 327.42 | 23.87 | 219.17 | 0.6002 | |
| 0 | 1 | 0 | 0 | -17.55 | 328.21 | 24.65 | 224.24 | 0.5723 | |
| 0 | 1 | 0 | 0 | -21.07 | 327.21 | 23.66 | 218.88 | 0.5988 | |
| 0 | 1 | 0 | 1 | -20.56 | 327.09 | 23.52 | 219.29 | 0.5923 | |
| 1 | 184 | 0 | 111 | -19.08 | 327.23 | 23.68 | 221.20 | 0.5783 | |
| 0 | 1 | 0 | 1 | -20.56 | 326.70 | 23.13 | 218.83 | 0.5888 | |
| 38 | -22 | 23 | -22 | -19.47 | 326.55 | 23.00 | 219.92 | 0.5762 | |
| 0 | -22 | 0 | -22 | -18.40 | 326.77 | 23.21 | 221.47 | 0.5670 | |
| 0 | 0 | 0 | 0 | -20.76 | 326.08 | 22.52 | 217.87 | 0.5857 | |
| 0 | 1 | 0 | 1 | -20.90 | 325.97 | 22.42 | 217.58 | 0.5863 | |
| 0 | 1 | 0 | 0 | -20.39 | 325.91 | 22.36 | 218.08 | 0.5803 | |
| 0 | 4 | 0 | 2 | -17.97 | 326.45 | 22.89 | 221.62 | 0.5593 | |
| 0 | 1 | 0 | 1 | -21.66 | 325.33 | 21.78 | 215.97 | 0.5892 | |
| 0 | 7 | 0 | 4 | -18.90 | 325.95 | 22.39 | 219.85 | 0.5645 | |
| 0 | 4 | 0 | 2 | -21.14 | 325.30 | 21.75 | 216.49 | 0.5832 | |
| 0 | 1 | 0 | 1 | -21.58 | 325.10 | 21.53 | 215.75 | 0.5863 | |
| 0 | 8 | 0 | 5 | -20.66 | 325.32 | 21.77 | 217.04 | 0.5781 | |
| 1 | 7 | 0 | 4 | -18.03 | 325.75 | 22.20 | 220.67 | 0.5534 | |
| 0 | 1 | 0 | 1 | -22.20 | 324.45 | 20.88 | 214.29 | 0.5880 | |
| 0 | 0 | 0 | 0 | -18.97 | 324.96 | 21.41 | 218.52 | 0.5563 | |
| 0 | 1 | 0 | 0 | -19.14 | 324.82 | 21.27 | 218.14 | 0.5570 | |
| 1 | 256 | 1 | 151 | -18.51 | 324.84 | 21.29 | 218.92 | 0.5502 | |
| 0 | -39 | 0 | -39 | -18.36 | 324.84 | 21.27 | 219.07 | 0.5483 | |
| 1 | -39 | 1 | -39 | -18.34 | 324.70 | 21.15 | 218.94 | 0.5470 | |
| 3 | -39 | 2 | -39 | -18.66 | 324.51 | 20.96 | 218.31 | 0.5488 | |
| 6 | -39 | 3 | -39 | -19.20 | 324.34 | 20.78 | 217.44 | 0.5533 | |
| 1 | -39 | 1 | -39 | -18.75 | 324.15 | 20.58 | 217.70 | 0.5465 | |
| 1 | -39 | 1 | -39 | -18.91 | 323.90 | 20.33 | 217.18 | 0.5460 | |
| 0 | -39 | 0 | -39 | -19.36 | 323.71 | 20.15 | 216.42 | 0.5496 | |
| 2 | -39 | 1 | -39 | -19.26 | 323.37 | 19.82 | 216.08 | 0.5456 | |
| 0 | 1 | 0 | 0 | -18.33 | 323.57 | 20.00 | 217.41 | 0.5365 | |
| 24 | -39 | 14 | -39 | -19.50 | 323.05 | 19.49 | 215.36 | 0.5456 | |
| Proj. U | - Projected umbra area in millionths of solar disc, negative values indicate | |
|
that the umbra consists of fragmented regions which cannot be separated without losing umbral area. In this way several spots (intensity minima in the umbra) have a common umbra, e.g. -2 means that the given spot shares an umbra with spot No.2, and the common U value is indicated at spot No.2. |
||
| Proj. WS | - Projected whole spot area in millionths of solar disc, negative values indicate | |
|
that several umbras have a common penumbra, e.g. -7 means that the given umbra shares a penumbra with umbra No.7, and the WS value is indicated at No.7. |
||
| Corr. U | - Corrected umbra area in millionths of solar hemisphere, for negative values see above | |
| Corr. WS | - Corrected whole spot area in millionths of solar hemisphere, for negative values see above | |
| B | - Heliographic latitude B; positive: North, negative: South | |
| L | - Heliographic longitude L | |
| LCM | - Longitudinal distance from the Sun's central meridian | |
| Pos. angle | - Position angle | |
| r | - Distance from the centre of Sun's disc in terms of Sun's radius | |