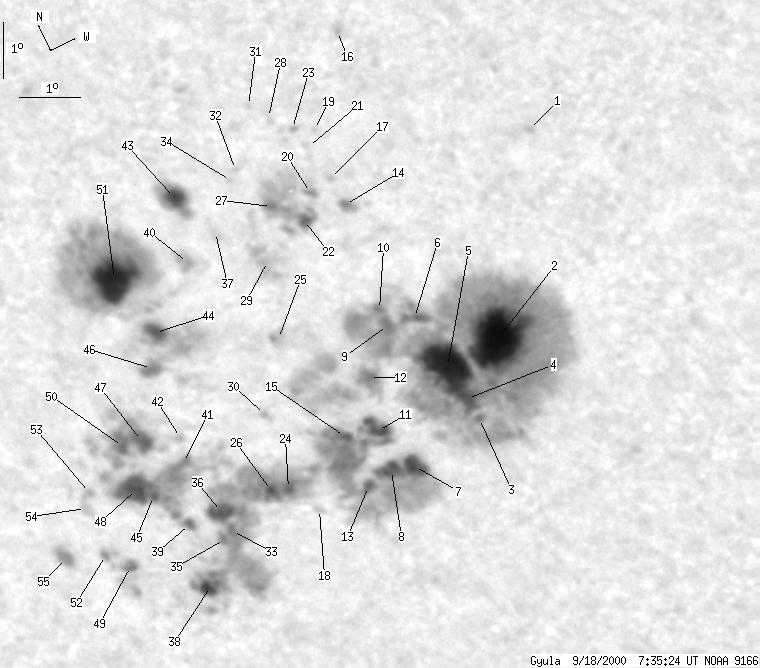
Gyula 2000-09-18 07:34:11 UT
| group | Proj. U | Proj. WS | Corr. U | Corr. WS | B | L | LCM | Pos. angle | r |
| 213 | 1797 | 135 | 1136 | -13.42 | 124.82 | -32.67 | 122.41 | 0.6236 | |
|
previous
or next day for the same group /
back to the solar disc Gyula 2000-09-18 07:34:11 UT |
| spot | Proj. U | Proj. WS | Corr. U | Corr. WS | B | L | LCM | Pos. angle | r |
| 0 | 2 | 0 | 1 | -10.81 | 130.74 | -26.76 | 123.72 | 0.5338 | |
| 53 | 695 | 32 | 426 | -13.78 | 128.40 | -29.10 | 125.89 | 0.5852 | |
| 2 | -2 | 1 | -2 | -14.93 | 127.32 | -30.16 | 126.52 | 0.6064 | |
| 6 | -2 | 4 | -2 | -14.55 | 127.33 | -30.15 | 126.00 | 0.6033 | |
| 28 | -2 | 17 | -2 | -13.90 | 127.33 | -30.17 | 125.09 | 0.5984 | |
| 5 | -2 | 3 | -2 | -12.99 | 127.29 | -30.20 | 123.76 | 0.5919 | |
| 5 | 600 | 3 | 392 | -15.33 | 125.78 | -31.72 | 125.71 | 0.6266 | |
| 4 | -7 | 3 | -7 | -15.27 | 125.36 | -32.14 | 125.26 | 0.6308 | |
| 2 | -2 | 1 | -2 | -12.95 | 126.78 | -30.71 | 123.27 | 0.5975 | |
| 1 | -2 | 1 | -2 | -12.67 | 126.81 | -30.67 | 122.89 | 0.5950 | |
| 7 | -7 | 4 | -7 | -14.50 | 125.56 | -31.94 | 124.39 | 0.6229 | |
| 2 | -2 | 1 | -2 | -13.66 | 125.98 | -31.50 | 123.60 | 0.6118 | |
| 1 | -7 | 1 | -7 | -15.38 | 124.81 | -32.68 | 124.96 | 0.6376 | |
| 1 | 4 | 1 | 2 | -10.82 | 127.21 | -30.29 | 120.49 | 0.5771 | |
| 2 | -7 | 1 | -7 | -14.41 | 124.90 | -32.59 | 123.74 | 0.6296 | |
| 0 | 1 | 0 | 1 | -8.22 | 128.67 | -28.82 | 117.63 | 0.5406 | |
| 0 | 1 | 0 | 1 | -10.37 | 127.28 | -30.21 | 119.87 | 0.5730 | |
| 0 | 2 | 0 | 1 | -15.45 | 123.75 | -33.74 | 124.22 | 0.6497 | |
| 0 | 1 | 0 | 0 | -9.56 | 127.46 | -30.03 | 118.76 | 0.5651 | |
| 1 | 61 | 1 | 37 | -10.47 | 126.81 | -30.68 | 119.64 | 0.5795 | |
| 0 | 3 | 0 | 2 | -9.78 | 127.21 | -30.28 | 118.90 | 0.5697 | |
| 2 | -20 | 1 | -20 | -10.82 | 126.48 | -31.02 | 119.89 | 0.5860 | |
| 0 | 1 | 0 | 1 | -9.42 | 127.12 | -30.37 | 118.27 | 0.5684 | |
| 2 | -7 | 1 | -7 | -14.94 | 123.52 | -33.97 | 123.36 | 0.6486 | |
| 0 | 7 | 0 | 4 | -12.53 | 124.93 | -32.56 | 121.16 | 0.6161 | |
| 1 | -7 | 1 | -7 | -14.90 | 123.14 | -34.36 | 123.00 | 0.6527 | |
| 3 | -20 | 2 | -20 | -10.46 | 126.03 | -31.47 | 118.98 | 0.5891 | |
| 0 | 3 | 0 | 2 | -9.12 | 126.83 | -30.65 | 117.57 | 0.5700 | |
| 0 | 18 | 0 | 11 | -11.30 | 125.49 | -32.00 | 119.81 | 0.6011 | |
| 0 | 1 | 0 | 1 | -13.64 | 123.90 | -33.59 | 121.90 | 0.6356 | |
| 0 | 2 | 0 | 1 | -8.83 | 126.62 | -30.86 | 116.95 | 0.5708 | |
| 0 | 1 | 0 | 1 | -9.72 | 125.82 | -31.67 | 117.71 | 0.5867 | |
| 1 | -7 | 1 | -7 | -15.30 | 122.12 | -35.37 | 122.79 | 0.6664 | |
| 0 | 1 | 0 | 1 | -9.86 | 125.65 | -31.83 | 117.80 | 0.5896 | |
| 1 | -7 | 1 | -7 | -15.37 | 121.78 | -35.72 | 122.63 | 0.6707 | |
| 7 | -7 | 5 | -7 | -14.95 | 122.06 | -35.44 | 122.28 | 0.6649 | |
| 0 | 6 | 0 | 3 | -10.57 | 124.92 | -32.56 | 118.30 | 0.6032 | |
| 6 | -7 | 4 | -7 | -16.07 | 120.97 | -36.52 | 122.95 | 0.6838 | |
| 1 | -7 | 1 | -7 | -14.94 | 121.38 | -36.12 | 121.78 | 0.6723 | |
| 0 | 6 | 0 | 4 | -10.87 | 124.09 | -33.40 | 118.13 | 0.6153 | |
| 2 | -7 | 1 | -7 | -13.94 | 122.06 | -35.42 | 120.96 | 0.6583 | |
| 0 | 1 | 0 | 0 | -13.55 | 122.21 | -35.28 | 120.53 | 0.6542 | |
| 5 | 20 | 3 | 12 | -9.86 | 124.58 | -32.91 | 116.99 | 0.6031 | |
| 6 | 326 | 4 | 208 | -11.76 | 122.90 | -34.60 | 118.55 | 0.6351 | |
| 1 | -7 | 1 | -7 | -14.31 | 121.18 | -36.30 | 120.83 | 0.6703 | |
| 6 | -44 | 4 | -44 | -12.30 | 122.53 | -34.96 | 119.05 | 0.6427 | |
| 6 | -7 | 4 | -7 | -13.39 | 121.56 | -35.93 | 119.86 | 0.6605 | |
| 11 | -7 | 7 | -7 | -14.14 | 120.92 | -36.58 | 120.41 | 0.6724 | |
| 2 | 26 | 1 | 18 | -15.34 | 119.93 | -37.56 | 121.30 | 0.6904 | |
| 2 | -7 | 1 | -7 | -13.36 | 121.21 | -36.27 | 119.58 | 0.6642 | |
| 25 | -44 | 16 | -44 | -10.75 | 122.78 | -34.72 | 117.03 | 0.6304 | |
| 1 | -49 | 1 | -49 | -15.01 | 119.63 | -37.87 | 120.67 | 0.6917 | |
| 0 | 2 | 0 | 1 | -13.94 | 120.09 | -37.40 | 119.60 | 0.6802 | |
| 0 | 1 | 0 | 1 | -14.13 | 119.89 | -37.59 | 119.72 | 0.6835 | |
| 2 | 5 | 1 | 4 | -14.77 | 118.89 | -38.60 | 119.90 | 0.6982 | |
| Proj. U | - Projected umbra area in millionths of solar disc, negative values indicate | |
|
that the umbra consists of fragmented regions which cannot be separated without losing umbral area. In this way several spots (intensity minima in the umbra) have a common umbra, e.g. -2 means that the given spot shares an umbra with spot No.2, and the common U value is indicated at spot No.2. |
||
| Proj. WS | - Projected whole spot area in millionths of solar disc, negative values indicate | |
|
that several umbras have a common penumbra, e.g. -7 means that the given umbra shares a penumbra with umbra No.7, and the WS value is indicated at No.7. |
||
| Corr. U | - Corrected umbra area in millionths of solar hemisphere, for negative values see above | |
| Corr. WS | - Corrected whole spot area in millionths of solar hemisphere, for negative values see above | |
| B | - Heliographic latitude B; positive: North, negative: South | |
| L | - Heliographic longitude L | |
| LCM | - Longitudinal distance from the Sun's central meridian | |
| Pos. angle | - Position angle | |
| r | - Distance from the centre of Sun's disc in terms of Sun's radius | |