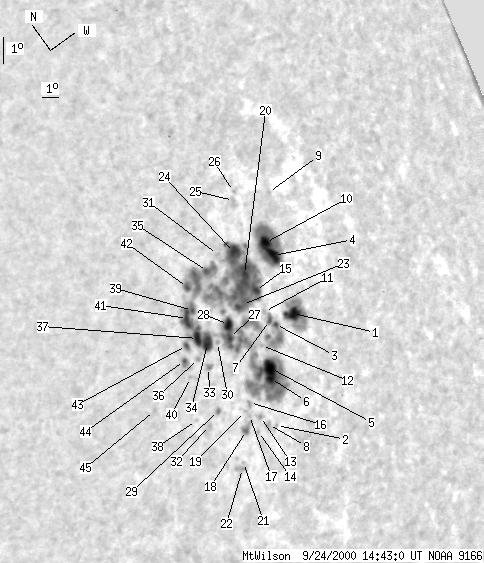
Mount Wilson 2000-09-24 14:43:00 UT
| group | Proj. U | Proj. WS | Corr. U | Corr. WS | B | L | LCM | Pos. angle | r |
| 135 | 1068 | 117 | 921 | -12.22 | 126.09 | 51.72 | 249.70 | 0.8198 | |
|
previous
or next day for the same group /
back to the solar disc Mount Wilson 2000-09-24 14:43:00 UT |
| spot | Proj. U | Proj. WS | Corr. U | Corr. WS | B | L | LCM | Pos. angle | r |
| 13 | 62 | 12 | 57 | -13.58 | 128.92 | 54.55 | 249.16 | 0.8494 | |
| 0 | 1 | 0 | 1 | -16.14 | 125.13 | 50.76 | 244.83 | 0.8242 | |
| 2 | 49 | 1 | 44 | -13.40 | 127.64 | 53.27 | 248.91 | 0.8378 | |
| 11 | 99 | 10 | 92 | -11.55 | 129.45 | 55.09 | 251.63 | 0.8486 | |
| 13 | 794 | 12 | 674 | -14.44 | 126.21 | 51.84 | 247.21 | 0.8282 | |
| 5 | -5 | 4 | -5 | -14.70 | 125.96 | 51.59 | 246.80 | 0.8268 | |
| 1 | -3 | 1 | -3 | -13.13 | 127.41 | 53.04 | 249.14 | 0.8349 | |
| 0 | 3 | 0 | 3 | -15.89 | 124.72 | 50.35 | 244.94 | 0.8196 | |
| 0 | 1 | 0 | 1 | -9.80 | 131.06 | 56.70 | 254.10 | 0.8584 | |
| 9 | -4 | 9 | -4 | -11.00 | 129.38 | 55.01 | 252.24 | 0.8465 | |
| 0 | 2 | 0 | 2 | -12.76 | 127.38 | 53.01 | 249.55 | 0.8335 | |
| 0 | 2 | 0 | 1 | -13.58 | 126.31 | 51.94 | 248.23 | 0.8263 | |
| 0 | 3 | 0 | 2 | -15.46 | 124.48 | 50.11 | 245.34 | 0.8159 | |
| 0 | 1 | 0 | 1 | -15.81 | 124.01 | 49.64 | 244.74 | 0.8129 | |
| 4 | -5 | 4 | -5 | -11.97 | 127.45 | 53.09 | 250.49 | 0.8319 | |
| 0 | 3 | 0 | 3 | -14.78 | 124.23 | 49.86 | 246.02 | 0.8112 | |
| 0 | 1 | 0 | 1 | -15.13 | 123.91 | 49.54 | 245.48 | 0.8096 | |
| 1 | 9 | 1 | 8 | -15.46 | 123.40 | 49.03 | 244.88 | 0.8060 | |
| 0 | 1 | 0 | 1 | -14.92 | 123.80 | 49.43 | 245.68 | 0.8077 | |
| 9 | -5 | 8 | -5 | -11.26 | 127.30 | 52.93 | 251.26 | 0.8285 | |
| 0 | 1 | 0 | 1 | -16.25 | 122.49 | 48.12 | 243.55 | 0.8006 | |
| 0 | 5 | 0 | 4 | -16.39 | 122.30 | 47.93 | 243.31 | 0.7994 | |
| 10 | -5 | 8 | -5 | -11.99 | 126.37 | 52.00 | 250.09 | 0.8220 | |
| 11 | -5 | 9 | -5 | -10.42 | 127.38 | 53.01 | 252.26 | 0.8270 | |
| 0 | 2 | 0 | 2 | -9.06 | 128.85 | 54.48 | 254.30 | 0.8370 | |
| 0 | 1 | 0 | 1 | -8.84 | 129.12 | 54.75 | 254.64 | 0.8390 | |
| 3 | -5 | 3 | -5 | -12.51 | 124.82 | 50.45 | 248.90 | 0.8090 | |
| 8 | -5 | 7 | -5 | -12.14 | 125.10 | 50.73 | 249.45 | 0.8106 | |
| 0 | 4 | 0 | 3 | -14.17 | 122.44 | 48.07 | 245.97 | 0.7920 | |
| 0 | 2 | 0 | 1 | -12.33 | 124.07 | 49.70 | 248.83 | 0.8013 | |
| 0 | 2 | 0 | 2 | -10.02 | 126.43 | 52.06 | 252.41 | 0.8169 | |
| 0 | 2 | 0 | 2 | -14.34 | 121.63 | 47.26 | 245.41 | 0.7848 | |
| 0 | 5 | 0 | 4 | -12.75 | 122.99 | 48.62 | 247.89 | 0.7922 | |
| 10 | -5 | 8 | -5 | -12.09 | 123.55 | 49.18 | 248.91 | 0.7953 | |
| 3 | -5 | 2 | -5 | -10.20 | 125.45 | 51.08 | 251.87 | 0.8079 | |
| 0 | 3 | 0 | 2 | -12.25 | 122.72 | 48.35 | 248.38 | 0.7877 | |
| 7 | -5 | 6 | -5 | -11.70 | 123.18 | 48.81 | 249.23 | 0.7903 | |
| 0 | 1 | 0 | 1 | -13.86 | 121.11 | 46.74 | 245.75 | 0.7778 | |
| 1 | -5 | 1 | -5 | -10.83 | 123.66 | 49.29 | 250.46 | 0.7922 | |
| 0 | 1 | 0 | 1 | -12.55 | 121.86 | 47.49 | 247.66 | 0.7802 | |
| 8 | -5 | 6 | -5 | -10.91 | 123.20 | 48.83 | 250.19 | 0.7880 | |
| 4 | -5 | 3 | -5 | -10.10 | 124.02 | 49.65 | 251.48 | 0.7935 | |
| 1 | -5 | 1 | -5 | -11.60 | 122.46 | 48.10 | 249.07 | 0.7828 | |
| 1 | 6 | 1 | 5 | -11.94 | 121.99 | 47.62 | 248.45 | 0.7793 | |
| 0 | 2 | 0 | 1 | -12.51 | 119.37 | 45.00 | 246.61 | 0.7545 | |
| Proj. U | - Projected umbra area in millionths of solar disc, negative values indicate | |
|
that the umbra consists of fragmented regions which cannot be separated without losing umbral area. In this way several spots (intensity minima in the umbra) have a common umbra, e.g. -2 means that the given spot shares an umbra with spot No.2, and the common U value is indicated at spot No.2. |
||
| Proj. WS | - Projected whole spot area in millionths of solar disc, negative values indicate | |
|
that several umbras have a common penumbra, e.g. -7 means that the given umbra shares a penumbra with umbra No.7, and the WS value is indicated at No.7. |
||
| Corr. U | - Corrected umbra area in millionths of solar hemisphere, for negative values see above | |
| Corr. WS | - Corrected whole spot area in millionths of solar hemisphere, for negative values see above | |
| B | - Heliographic latitude B; positive: North, negative: South | |
| L | - Heliographic longitude L | |
| LCM | - Longitudinal distance from the Sun's central meridian | |
| Pos. angle | - Position angle | |
| r | - Distance from the centre of Sun's disc in terms of Sun's radius | |