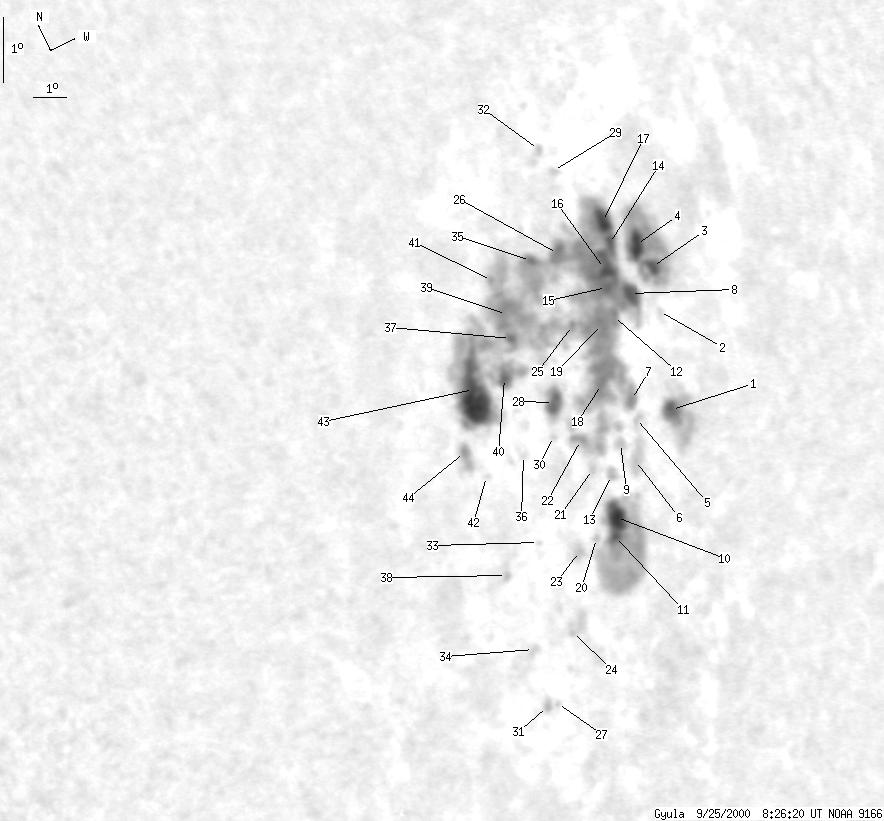
Gyula 2000-09-25 08:24:20 UT
| group | Proj. U | Proj. WS | Corr. U | Corr. WS | B | L | LCM | Pos. angle | r |
| 112 | 768 | 125 | 860 | -11.67 | 125.93 | 61.30 | 253.29 | 0.8980 | |
|
previous
or next day for the same group /
back to the solar disc Gyula 2000-09-25 08:24:20 UT |
| spot | Proj. U | Proj. WS | Corr. U | Corr. WS | B | L | LCM | Pos. angle | r |
| 4 | 26 | 5 | 33 | -13.37 | 129.12 | 64.49 | 252.30 | 0.9233 | |
| 0 | 1 | 0 | 1 | -11.86 | 129.55 | 64.93 | 254.01 | 0.9238 | |
| 2 | 61 | 3 | 77 | -11.25 | 129.71 | 65.07 | 254.68 | 0.9238 | |
| 4 | -3 | 5 | -3 | -10.78 | 129.33 | 64.69 | 255.09 | 0.9207 | |
| 0 | 2 | 0 | 2 | -13.11 | 127.78 | 63.14 | 252.24 | 0.9141 | |
| 0 | 8 | 0 | 9 | -13.67 | 127.36 | 62.73 | 251.54 | 0.9123 | |
| 2 | 538 | 2 | 588 | -12.79 | 127.64 | 63.01 | 252.54 | 0.9126 | |
| 4 | -7 | 5 | -7 | -11.39 | 128.58 | 63.94 | 254.27 | 0.9166 | |
| 0 | 2 | 0 | 3 | -13.26 | 126.84 | 62.21 | 251.84 | 0.9080 | |
| 7 | 92 | 9 | 107 | -14.27 | 126.20 | 61.56 | 250.58 | 0.9054 | |
| 2 | -10 | 2 | -10 | -14.52 | 126.03 | 61.40 | 250.26 | 0.9047 | |
| 3 | -7 | 3 | -7 | -11.43 | 127.78 | 63.16 | 254.04 | 0.9114 | |
| 0 | 3 | 0 | 3 | -13.64 | 126.34 | 61.70 | 251.29 | 0.9052 | |
| 2 | -7 | 3 | -7 | -10.45 | 128.30 | 63.66 | 255.21 | 0.9133 | |
| 1 | -7 | 2 | -7 | -11.02 | 127.79 | 63.15 | 254.47 | 0.9107 | |
| 8 | -7 | 10 | -7 | -10.75 | 127.91 | 63.28 | 254.79 | 0.9111 | |
| 4 | -7 | 5 | -7 | -10.09 | 128.26 | 63.63 | 255.59 | 0.9125 | |
| 3 | -7 | 3 | -7 | -12.20 | 126.76 | 62.13 | 252.95 | 0.9055 | |
| 7 | -7 | 8 | -7 | -11.41 | 127.28 | 62.66 | 253.94 | 0.9079 | |
| 0 | 1 | 0 | 1 | -14.28 | 125.38 | 60.76 | 250.34 | 0.8998 | |
| 0 | 1 | 0 | 1 | -13.35 | 125.69 | 61.06 | 251.43 | 0.9001 | |
| 3 | -7 | 3 | -7 | -12.81 | 125.51 | 60.88 | 251.97 | 0.8977 | |
| 0 | 3 | 0 | 3 | -14.36 | 124.71 | 60.08 | 250.06 | 0.8950 | |
| 0 | 6 | 0 | 7 | -15.41 | 123.90 | 59.27 | 248.69 | 0.8914 | |
| 1 | -7 | 1 | -7 | -11.17 | 126.26 | 61.62 | 253.93 | 0.9001 | |
| 4 | -7 | 4 | -7 | -10.05 | 126.42 | 61.79 | 255.19 | 0.8994 | |
| 0 | 0 | 0 | 0 | -16.20 | 122.99 | 58.37 | 247.55 | 0.8866 | |
| 5 | 11 | 5 | 12 | -12.01 | 124.98 | 60.34 | 252.68 | 0.8922 | |
| 0 | 1 | 0 | 1 | -8.91 | 127.06 | 62.43 | 256.57 | 0.9022 | |
| 0 | 1 | 0 | 1 | -12.35 | 124.71 | 60.08 | 252.24 | 0.8909 | |
| 0 | 1 | 0 | 1 | -16.19 | 122.62 | 57.99 | 247.44 | 0.8837 | |
| 0 | 1 | 0 | 1 | -8.47 | 126.78 | 62.14 | 257.00 | 0.8993 | |
| 0 | 0 | 0 | 0 | -13.78 | 123.45 | 58.82 | 250.31 | 0.8844 | |
| 0 | 1 | 0 | 2 | -15.24 | 122.55 | 57.91 | 248.45 | 0.8808 | |
| 1 | -7 | 1 | -7 | -9.87 | 125.42 | 60.79 | 255.13 | 0.8916 | |
| 0 | 0 | 0 | 0 | -12.41 | 123.56 | 58.92 | 251.85 | 0.8822 | |
| 1 | -7 | 1 | -7 | -10.72 | 124.06 | 59.43 | 253.85 | 0.8826 | |
| 0 | 1 | 0 | 1 | -13.90 | 122.18 | 57.55 | 249.80 | 0.8748 | |
| 8 | -7 | 8 | -7 | -10.30 | 124.22 | 59.60 | 254.36 | 0.8832 | |
| 2 | -7 | 3 | -7 | -11.19 | 123.54 | 58.91 | 253.19 | 0.8795 | |
| 1 | -7 | 1 | -7 | -9.69 | 124.05 | 59.43 | 254.98 | 0.8807 | |
| 0 | 1 | 0 | 1 | -12.31 | 122.30 | 57.67 | 251.59 | 0.8721 | |
| 33 | -7 | 33 | -7 | -11.13 | 122.54 | 57.91 | 252.97 | 0.8714 | |
| 0 | 6 | 0 | 5 | -11.82 | 121.81 | 57.18 | 251.99 | 0.8669 | |
| Proj. U | - Projected umbra area in millionths of solar disc, negative values indicate | |
|
that the umbra consists of fragmented regions which cannot be separated without losing umbral area. In this way several spots (intensity minima in the umbra) have a common umbra, e.g. -2 means that the given spot shares an umbra with spot No.2, and the common U value is indicated at spot No.2. |
||
| Proj. WS | - Projected whole spot area in millionths of solar disc, negative values indicate | |
|
that several umbras have a common penumbra, e.g. -7 means that the given umbra shares a penumbra with umbra No.7, and the WS value is indicated at No.7. |
||
| Corr. U | - Corrected umbra area in millionths of solar hemisphere, for negative values see above | |
| Corr. WS | - Corrected whole spot area in millionths of solar hemisphere, for negative values see above | |
| B | - Heliographic latitude B; positive: North, negative: South | |
| L | - Heliographic longitude L | |
| LCM | - Longitudinal distance from the Sun's central meridian | |
| Pos. angle | - Position angle | |
| r | - Distance from the centre of Sun's disc in terms of Sun's radius | |