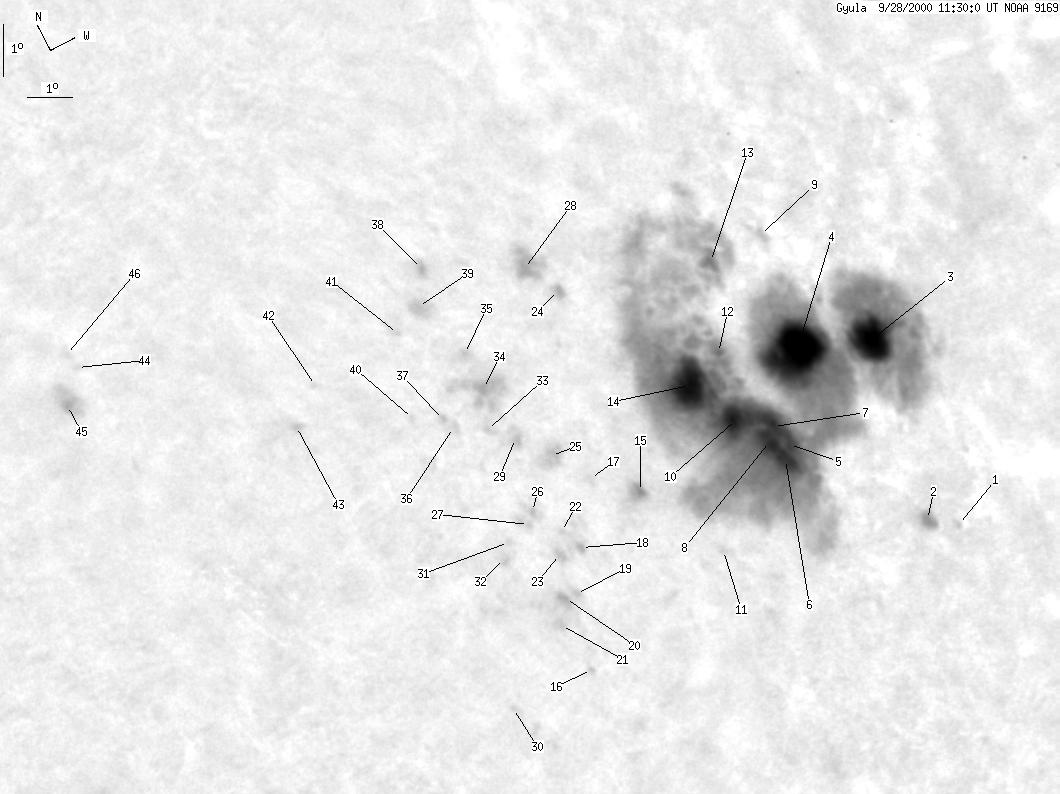
Gyula 2000-09-28 11:30:43 UT
| group | Proj. U | Proj. WS | Corr. U | Corr. WS | B | L | LCM | Pos. angle | r |
| 149 | 1660 | 140 | 1533 | 10.24 | 81.48 | 58.13 | 277.86 | 0.8449 | |
|
previous
or next day for the same group /
back to the solar disc Gyula 2000-09-28 11:30:43 UT |
| spot | Proj. U | Proj. WS | Corr. U | Corr. WS | B | L | LCM | Pos. angle | r |
| 0 | 1 | 0 | 1 | 6.63 | 83.78 | 60.43 | 273.74 | 0.8678 | |
| 0 | 6 | 0 | 6 | 6.94 | 83.08 | 59.73 | 274.04 | 0.8615 | |
| 25 | 1516 | 25 | 1418 | 9.63 | 84.72 | 61.37 | 277.25 | 0.8743 | |
| 60 | -3 | 57 | -3 | 10.19 | 82.59 | 59.24 | 277.81 | 0.8557 | |
| 4 | -3 | 3 | -3 | 9.20 | 80.92 | 57.57 | 276.57 | 0.8408 | |
| 18 | -3 | 17 | -3 | 9.04 | 80.56 | 57.22 | 276.36 | 0.8376 | |
| -6 | -3 | -6 | -3 | 9.43 | 80.70 | 57.35 | 276.84 | 0.8387 | |
| -6 | -3 | -6 | -3 | 9.35 | 80.46 | 57.11 | 276.72 | 0.8365 | |
| 0 | 3 | 0 | 3 | 11.95 | 83.79 | 60.44 | 279.89 | 0.8659 | |
| 10 | -3 | 9 | -3 | 9.90 | 80.01 | 56.67 | 277.37 | 0.8321 | |
| 0 | 1 | 0 | 1 | 8.41 | 77.78 | 54.43 | 275.47 | 0.8105 | |
| 1 | -3 | 1 | -3 | 10.92 | 80.74 | 57.39 | 278.61 | 0.8387 | |
| 3 | -3 | 3 | -3 | 12.09 | 82.08 | 58.73 | 280.02 | 0.8508 | |
| 27 | -3 | 24 | -3 | 10.77 | 79.62 | 56.27 | 278.41 | 0.8281 | |
| 0 | 7 | 0 | 5 | 9.87 | 76.83 | 53.48 | 277.24 | 0.8004 | |
| 0 | 1 | 0 | 0 | 8.09 | 73.38 | 50.04 | 274.84 | 0.7638 | |
| 0 | 3 | 0 | 3 | 10.49 | 75.95 | 52.60 | 278.00 | 0.7911 | |
| 0 | 2 | 0 | 1 | 9.70 | 74.80 | 51.45 | 276.98 | 0.7789 | |
| 0 | 1 | 0 | 1 | 9.16 | 74.07 | 50.72 | 276.27 | 0.7711 | |
| 0 | 3 | 0 | 2 | 9.21 | 73.77 | 50.42 | 276.32 | 0.7678 | |
| 0 | 3 | 0 | 2 | 8.90 | 73.36 | 50.01 | 275.90 | 0.7632 | |
| 0 | 1 | 0 | 0 | 10.08 | 74.61 | 51.26 | 277.46 | 0.7768 | |
| 0 | 2 | 0 | 2 | 9.81 | 74.25 | 50.91 | 277.11 | 0.7730 | |
| 0 | 2 | 0 | 2 | 13.14 | 78.15 | 54.80 | 281.30 | 0.8137 | |
| 0 | 9 | 0 | 7 | 11.12 | 75.47 | 52.12 | 278.80 | 0.7860 | |
| 0 | 1 | 0 | 1 | 10.58 | 74.29 | 50.94 | 278.11 | 0.7733 | |
| 0 | 3 | 0 | 2 | 10.45 | 74.03 | 50.68 | 277.94 | 0.7705 | |
| 0 | 17 | 0 | 14 | 13.74 | 77.74 | 54.39 | 282.06 | 0.8098 | |
| 0 | 7 | 0 | 6 | 11.64 | 74.98 | 51.63 | 279.48 | 0.7808 | |
| 0 | 0 | 0 | 0 | 8.25 | 71.35 | 48.00 | 274.96 | 0.7406 | |
| 0 | 1 | 0 | 1 | 10.39 | 73.39 | 50.04 | 277.87 | 0.7634 | |
| 0 | 5 | 0 | 4 | 10.22 | 73.09 | 49.74 | 277.64 | 0.7600 | |
| 0 | 1 | 0 | 1 | 12.00 | 74.54 | 51.19 | 279.95 | 0.7761 | |
| 1 | 27 | 1 | 21 | 12.55 | 75.06 | 51.71 | 280.64 | 0.7818 | |
| 0 | 3 | 0 | 3 | 13.21 | 75.20 | 51.85 | 281.48 | 0.7835 | |
| 0 | 2 | 0 | 2 | 12.32 | 73.89 | 50.54 | 280.38 | 0.7691 | |
| 0 | 2 | 0 | 2 | 12.51 | 73.81 | 50.46 | 280.63 | 0.7683 | |
| 0 | 4 | 0 | 3 | 14.62 | 75.59 | 52.25 | 283.26 | 0.7883 | |
| 0 | 7 | 0 | 5 | 14.17 | 74.94 | 51.59 | 282.72 | 0.7812 | |
| 0 | 1 | 0 | 1 | 12.81 | 73.19 | 49.84 | 281.04 | 0.7616 | |
| 0 | 0 | 0 | 0 | 13.99 | 74.15 | 50.80 | 282.54 | 0.7726 | |
| 0 | 2 | 0 | 1 | 14.03 | 71.81 | 48.46 | 282.76 | 0.7468 | |
| 0 | 1 | 0 | 1 | 13.68 | 70.91 | 47.56 | 282.35 | 0.7364 | |
| 0 | 1 | 0 | 1 | 16.27 | 67.71 | 44.36 | 286.33 | 0.7017 | |
| 0 | 12 | 0 | 8 | 15.86 | 67.03 | 43.68 | 285.86 | 0.6929 | |
| 0 | 2 | 0 | 2 | 16.53 | 67.69 | 44.34 | 286.70 | 0.7019 | |
| Proj. U | - Projected umbra area in millionths of solar disc, negative values indicate | |
|
that the umbra consists of fragmented regions which cannot be separated without losing umbral area. In this way several spots (intensity minima in the umbra) have a common umbra, e.g. -2 means that the given spot shares an umbra with spot No.2, and the common U value is indicated at spot No.2. |
||
| Proj. WS | - Projected whole spot area in millionths of solar disc, negative values indicate | |
|
that several umbras have a common penumbra, e.g. -7 means that the given umbra shares a penumbra with umbra No.7, and the WS value is indicated at No.7. |
||
| Corr. U | - Corrected umbra area in millionths of solar hemisphere, for negative values see above | |
| Corr. WS | - Corrected whole spot area in millionths of solar hemisphere, for negative values see above | |
| B | - Heliographic latitude B; positive: North, negative: South | |
| L | - Heliographic longitude L | |
| LCM | - Longitudinal distance from the Sun's central meridian | |
| Pos. angle | - Position angle | |
| r | - Distance from the centre of Sun's disc in terms of Sun's radius | |