Gyula 2000-09-29 07:20:43 UT
| group | Proj. U | Proj. WS | Corr. U | Corr. WS | B | L | LCM | Pos. angle | r |
| 122 | 855 | 70 | 473 | -11.19 | 352.27 | -20.17 | 132.32 | 0.4561 | |
|
previous
or next day for the same group /
back to the solar disc Gyula 2000-09-29 07:20:43 UT |
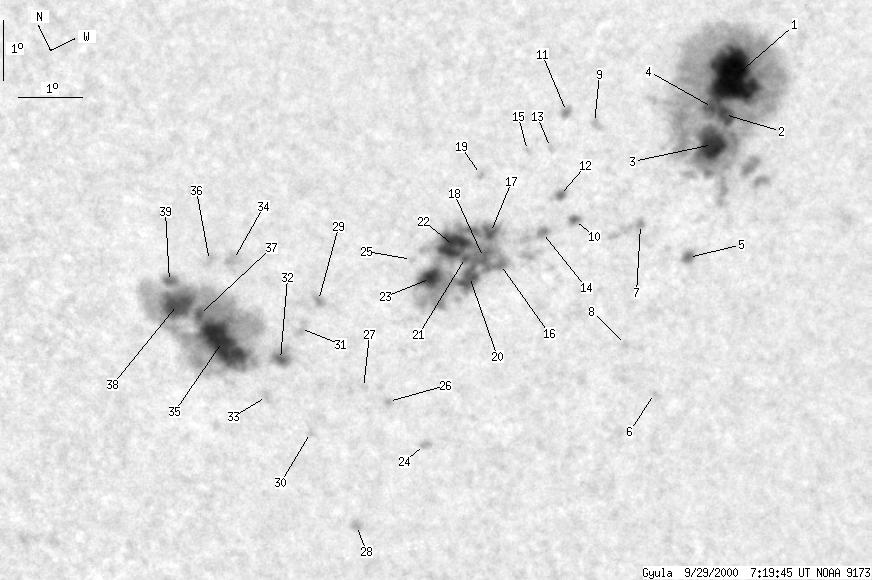
| spot | Proj. U | Proj. WS | Corr. U | Corr. WS | B | L | LCM | Pos. angle | r |
| 36 | 387 | 20 | 209 | -10.62 | 356.57 | -15.87 | 137.63 | 0.4005 | |
| 3 | -1 | 2 | -1 | -11.16 | 356.12 | -16.32 | 137.74 | 0.4117 | |
| 11 | -1 | 6 | -1 | -11.51 | 355.71 | -16.73 | 137.60 | 0.4202 | |
| 1 | -1 | 1 | -1 | -10.89 | 356.00 | -16.44 | 137.09 | 0.4098 | |
| 1 | 7 | 1 | 4 | -13.03 | 354.52 | -17.92 | 138.04 | 0.4501 | |
| 0 | 0 | 0 | 0 | -14.94 | 352.80 | -19.64 | 138.21 | 0.4894 | |
| 1 | 8 | 0 | 4 | -12.27 | 354.03 | -18.41 | 136.09 | 0.4468 | |
| 0 | 1 | 0 | 0 | -13.97 | 352.77 | -19.68 | 136.77 | 0.4790 | |
| 0 | 2 | 0 | 1 | -10.46 | 354.13 | -18.32 | 133.23 | 0.4259 | |
| 0 | 4 | 0 | 2 | -11.74 | 353.15 | -19.29 | 133.89 | 0.4507 | |
| 0 | 4 | 0 | 2 | -10.10 | 353.84 | -18.59 | 132.16 | 0.4253 | |
| 0 | 4 | 0 | 2 | -11.31 | 353.12 | -19.32 | 133.14 | 0.4464 | |
| 0 | 1 | 0 | 0 | -10.55 | 353.30 | -19.15 | 132.11 | 0.4365 | |
| 1 | 189 | 1 | 106 | -11.74 | 352.59 | -19.85 | 133.06 | 0.4569 | |
| 0 | 0 | 0 | 0 | -10.42 | 352.97 | -19.48 | 131.39 | 0.4390 | |
| 1 | -14 | 0 | -14 | -11.98 | 351.62 | -20.83 | 132.08 | 0.4706 | |
| 3 | -14 | 2 | -14 | -11.41 | 351.78 | -20.66 | 131.38 | 0.4628 | |
| 3 | -14 | 2 | -14 | -11.77 | 351.43 | -21.02 | 131.49 | 0.4706 | |
| 0 | 1 | 0 | 0 | -10.55 | 352.10 | -20.34 | 130.38 | 0.4504 | |
| 9 | -14 | 5 | -14 | -11.96 | 351.11 | -21.33 | 131.37 | 0.4762 | |
| 1 | -14 | 1 | -14 | -11.62 | 351.23 | -21.20 | 130.99 | 0.4713 | |
| 6 | -14 | 3 | -14 | -11.37 | 351.17 | -21.27 | 130.49 | 0.4696 | |
| 4 | -14 | 2 | -14 | -11.68 | 350.54 | -21.90 | 130.16 | 0.4800 | |
| 0 | 1 | 0 | 1 | -14.26 | 348.99 | -23.45 | 132.19 | 0.5226 | |
| 0 | 1 | 0 | 0 | -11.39 | 350.39 | -22.05 | 129.51 | 0.4790 | |
| 0 | 1 | 0 | 0 | -13.35 | 348.79 | -23.66 | 130.59 | 0.5162 | |
| 0 | 1 | 0 | 1 | -12.98 | 348.54 | -23.90 | 129.74 | 0.5155 | |
| 0 | 2 | 0 | 1 | -15.06 | 347.26 | -25.18 | 131.32 | 0.5492 | |
| 0 | 3 | 0 | 2 | -11.36 | 348.72 | -23.72 | 127.41 | 0.4986 | |
| 0 | 0 | 0 | 0 | -13.34 | 347.35 | -25.10 | 128.91 | 0.5325 | |
| 0 | 4 | 0 | 2 | -11.75 | 348.17 | -24.27 | 127.39 | 0.5086 | |
| 2 | 225 | 1 | 131 | -12.02 | 347.64 | -24.80 | 127.23 | 0.5173 | |
| 0 | 1 | 0 | 1 | -12.53 | 347.01 | -25.44 | 127.31 | 0.5292 | |
| 0 | 4 | 0 | 2 | -10.26 | 347.75 | -24.69 | 124.49 | 0.5007 | |
| 27 | -32 | 16 | -32 | -11.35 | 346.85 | -25.59 | 125.30 | 0.5209 | |
| 0 | 4 | 0 | 2 | -10.14 | 347.43 | -25.01 | 123.95 | 0.5037 | |
| 1 | -32 | 1 | -32 | -10.86 | 346.80 | -25.64 | 124.47 | 0.5175 | |
| 10 | -32 | 6 | -32 | -10.61 | 346.57 | -25.86 | 123.81 | 0.5181 | |
| 1 | -32 | 0 | -32 | -10.26 | 346.61 | -25.83 | 123.29 | 0.5148 | |
| Proj. U | - Projected umbra area in millionths of solar disc, negative values indicate | |
|
that the umbra consists of fragmented regions which cannot be separated without losing umbral area. In this way several spots (intensity minima in the umbra) have a common umbra, e.g. -2 means that the given spot shares an umbra with spot No.2, and the common U value is indicated at spot No.2. |
||
| Proj. WS | - Projected whole spot area in millionths of solar disc, negative values indicate | |
|
that several umbras have a common penumbra, e.g. -7 means that the given umbra shares a penumbra with umbra No.7, and the WS value is indicated at No.7. |
||
| Corr. U | - Corrected umbra area in millionths of solar hemisphere, for negative values see above | |
| Corr. WS | - Corrected whole spot area in millionths of solar hemisphere, for negative values see above | |
| B | - Heliographic latitude B; positive: North, negative: South | |
| L | - Heliographic longitude L | |
| LCM | - Longitudinal distance from the Sun's central meridian | |
| Pos. angle | - Position angle | |
| r | - Distance from the centre of Sun's disc in terms of Sun's radius | |