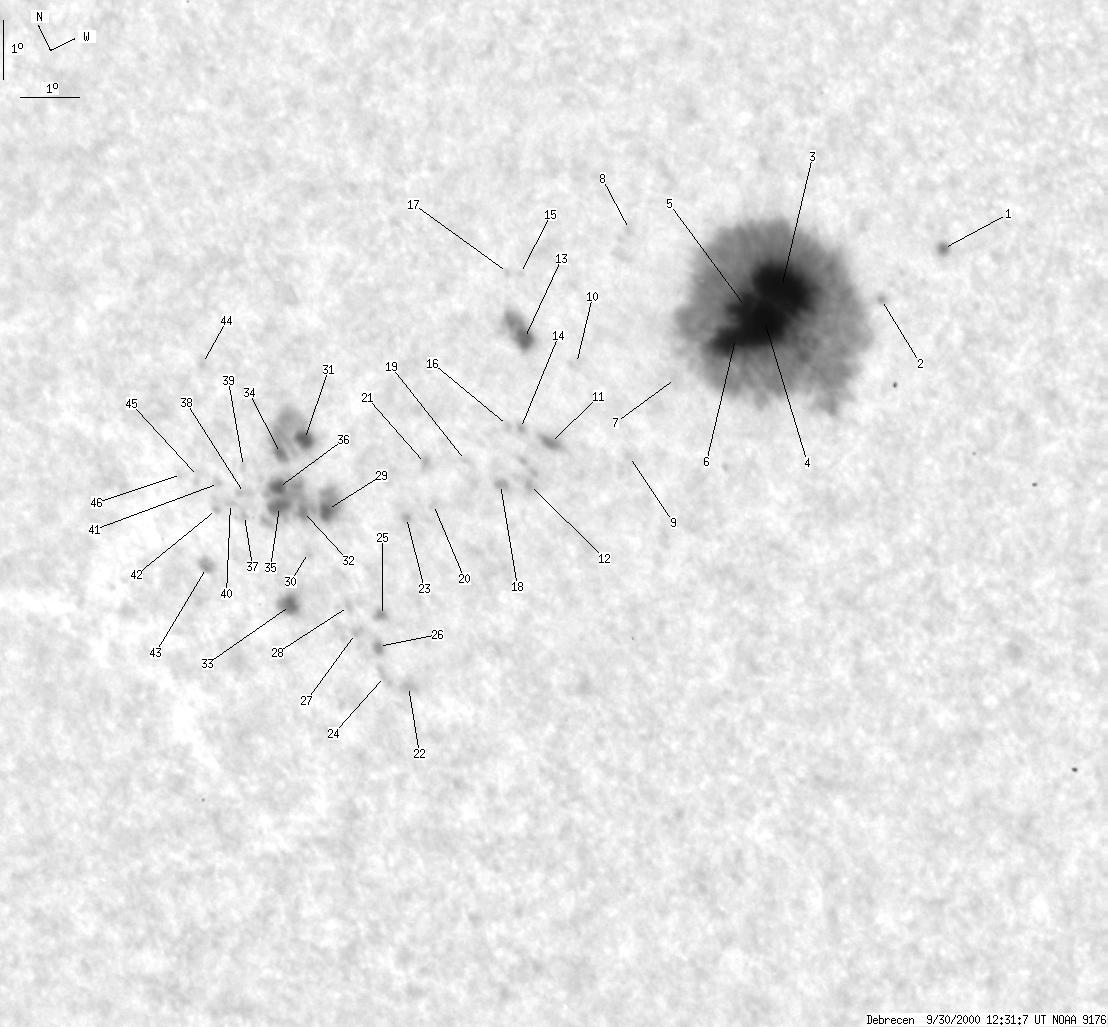
Debrecen 2000-09-30 12:34:06 UT
| group | Proj. U | Proj. WS | Corr. U | Corr. WS | B | L | LCM | Pos. angle | r |
| 126 | 866 | 78 | 548 | -7.91 | 321.32 | -35.08 | 112.33 | 0.6157 | |
|
previous
or next day for the same group /
back to the solar disc Debrecen 2000-09-30 12:34:06 UT |
| spot | Proj. U | Proj. WS | Corr. U | Corr. WS | B | L | LCM | Pos. angle | r |
| 1 | 4 | 0 | 3 | -7.79 | 327.28 | -29.12 | 116.08 | 0.5389 | |
| 0 | 1 | 0 | 1 | -8.20 | 325.92 | -30.48 | 115.69 | 0.5592 | |
| 98 | 610 | 59 | 371 | -7.51 | 324.48 | -31.92 | 113.54 | 0.5739 | |
| -3 | -3 | -3 | -3 | -7.89 | 323.94 | -32.46 | 113.78 | 0.5831 | |
| -3 | -3 | -3 | -3 | -7.60 | 323.76 | -32.64 | 113.19 | 0.5838 | |
| -3 | -3 | -3 | -3 | -8.00 | 323.33 | -33.06 | 113.55 | 0.5916 | |
| 0 | 2 | 0 | 2 | -8.28 | 322.04 | -34.36 | 113.13 | 0.6096 | |
| 0 | 2 | 0 | 2 | -5.90 | 322.57 | -33.83 | 109.76 | 0.5906 | |
| 0 | 1 | 0 | 1 | -9.17 | 320.60 | -35.80 | 113.58 | 0.6324 | |
| 0 | 3 | 0 | 2 | -7.56 | 320.58 | -35.82 | 111.18 | 0.6245 | |
| 2 | 10 | 1 | 6 | -8.57 | 319.44 | -36.96 | 112.03 | 0.6437 | |
| 1 | 15 | 1 | 10 | -9.10 | 318.69 | -37.71 | 112.36 | 0.6554 | |
| 4 | 24 | 3 | 15 | -6.94 | 319.95 | -36.45 | 109.90 | 0.6295 | |
| 0 | 1 | 0 | 1 | -8.22 | 319.07 | -37.32 | 111.32 | 0.6465 | |
| 0 | 0 | 0 | 0 | -5.99 | 320.45 | -35.95 | 108.72 | 0.6188 | |
| 0 | 1 | 0 | 1 | -8.11 | 318.89 | -37.51 | 111.06 | 0.6483 | |
| 0 | 1 | 0 | 0 | -5.91 | 320.24 | -36.15 | 108.50 | 0.6211 | |
| 0 | 3 | 0 | 2 | -8.94 | 318.22 | -38.18 | 111.88 | 0.6604 | |
| 0 | 1 | 0 | 0 | -8.42 | 317.86 | -38.54 | 110.95 | 0.6623 | |
| 0 | 1 | 0 | 0 | -8.90 | 316.90 | -39.50 | 111.14 | 0.6761 | |
| 0 | 3 | 0 | 2 | -8.27 | 317.16 | -39.24 | 110.38 | 0.6701 | |
| 0 | 3 | 0 | 2 | -11.47 | 314.59 | -41.81 | 113.42 | 0.7144 | |
| 0 | 1 | 0 | 1 | -8.96 | 316.31 | -40.09 | 110.92 | 0.6834 | |
| 0 | 3 | 0 | 2 | -11.21 | 314.27 | -42.12 | 112.92 | 0.7167 | |
| 0 | 6 | 0 | 4 | -10.29 | 314.89 | -41.51 | 112.02 | 0.7057 | |
| 0 | 2 | 0 | 2 | -10.73 | 314.49 | -41.91 | 112.40 | 0.7121 | |
| 0 | 2 | 0 | 1 | -10.43 | 314.23 | -42.17 | 111.88 | 0.7138 | |
| 0 | 1 | 0 | 1 | -9.99 | 314.39 | -42.01 | 111.38 | 0.7101 | |
| 4 | 132 | 3 | 91 | -8.47 | 315.02 | -41.38 | 109.62 | 0.6965 | |
| 0 | 3 | 0 | 2 | -9.01 | 314.25 | -42.15 | 110.00 | 0.7077 | |
| 3 | -29 | 2 | -29 | -7.33 | 315.30 | -41.09 | 108.20 | 0.6886 | |
| 2 | -29 | 2 | -29 | -8.38 | 314.58 | -41.82 | 109.31 | 0.7013 | |
| 2 | 11 | 1 | 8 | -9.70 | 313.37 | -43.03 | 110.52 | 0.7205 | |
| 1 | -29 | 1 | -29 | -7.42 | 314.75 | -41.65 | 108.08 | 0.6956 | |
| 5 | -29 | 3 | -29 | -8.19 | 314.20 | -42.20 | 108.89 | 0.7050 | |
| 3 | -29 | 2 | -29 | -7.91 | 314.38 | -42.02 | 108.58 | 0.7018 | |
| 0 | 1 | 0 | 1 | -8.16 | 313.49 | -42.91 | 108.53 | 0.7131 | |
| 0 | 3 | 0 | 2 | -7.84 | 313.71 | -42.69 | 108.19 | 0.7093 | |
| 0 | 1 | 0 | 1 | -7.44 | 313.96 | -42.43 | 107.76 | 0.7049 | |
| 0 | 1 | 0 | 0 | -7.92 | 313.36 | -43.04 | 108.15 | 0.7137 | |
| 0 | 1 | 0 | 1 | -7.57 | 313.35 | -43.05 | 107.68 | 0.7126 | |
| 0 | 1 | 0 | 1 | -7.94 | 313.05 | -43.35 | 108.05 | 0.7174 | |
| 0 | 4 | 0 | 3 | -8.75 | 312.26 | -44.14 | 108.79 | 0.7294 | |
| 0 | 1 | 0 | 1 | -5.75 | 314.23 | -42.17 | 105.55 | 0.6956 | |
| 0 | 4 | 0 | 3 | -7.38 | 313.06 | -43.34 | 107.30 | 0.7153 | |
| 0 | 2 | 0 | 2 | -7.27 | 312.77 | -43.63 | 107.04 | 0.7182 | |
| Proj. U | - Projected umbra area in millionths of solar disc, negative values indicate | |
|
that the umbra consists of fragmented regions which cannot be separated without losing umbral area. In this way several spots (intensity minima in the umbra) have a common umbra, e.g. -2 means that the given spot shares an umbra with spot No.2, and the common U value is indicated at spot No.2. |
||
| Proj. WS | - Projected whole spot area in millionths of solar disc, negative values indicate | |
|
that several umbras have a common penumbra, e.g. -7 means that the given umbra shares a penumbra with umbra No.7, and the WS value is indicated at No.7. |
||
| Corr. U | - Corrected umbra area in millionths of solar hemisphere, for negative values see above | |
| Corr. WS | - Corrected whole spot area in millionths of solar hemisphere, for negative values see above | |
| B | - Heliographic latitude B; positive: North, negative: South | |
| L | - Heliographic longitude L | |
| LCM | - Longitudinal distance from the Sun's central meridian | |
| Pos. angle | - Position angle | |
| r | - Distance from the centre of Sun's disc in terms of Sun's radius | |