Gyula 2000-10-01 13:45:57 UT
| group | Proj. U | Proj. WS | Corr. U | Corr. WS | B | L | LCM | Pos. angle | r |
| 130 | 991 | 72 | 542 | -8.09 | 321.61 | -20.91 | 125.56 | 0.4337 | |
|
previous
or next day for the same group /
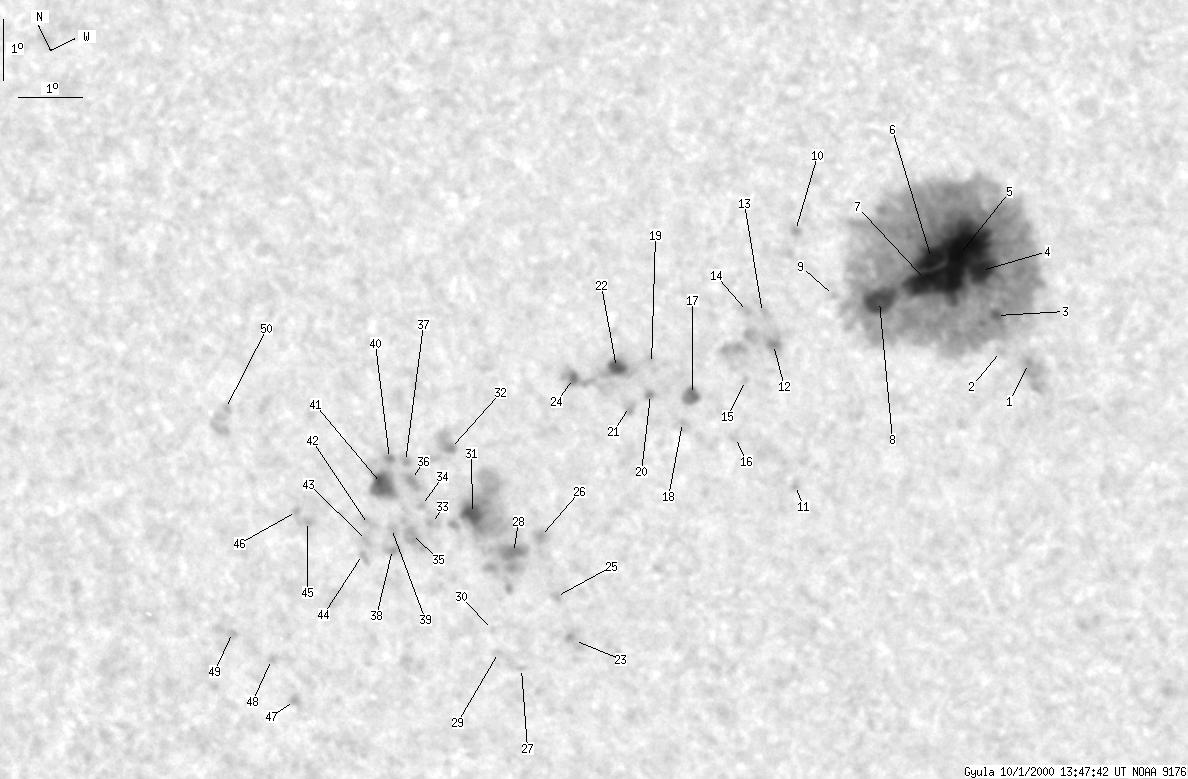
back to the solar disc Gyula 2000-10-01 13:45:57 UT |
| spot | Proj. U | Proj. WS | Corr. U | Corr. WS | B | L | LCM | Pos. angle | r |
| 0 | 18 | 0 | 10 | -9.84 | 324.69 | -17.82 | 132.75 | 0.4124 | |
| 0 | 1 | 0 | 0 | -9.53 | 324.35 | -18.15 | 131.66 | 0.4130 | |
| 1 | 660 | 1 | 356 | -8.98 | 324.57 | -17.93 | 130.99 | 0.4046 | |
| 106 | -3 | 57 | -3 | -8.17 | 324.66 | -17.86 | 129.55 | 0.3953 | |
| -4 | -3 | -4 | -3 | -7.80 | 324.58 | -17.94 | 128.68 | 0.3926 | |
| -4 | -3 | -4 | -3 | -7.68 | 324.06 | -18.46 | 127.64 | 0.3979 | |
| -4 | -3 | -4 | -3 | -7.97 | 323.84 | -18.68 | 127.88 | 0.4036 | |
| 7 | -3 | 4 | -3 | -7.97 | 323.05 | -19.47 | 126.72 | 0.4136 | |
| 0 | 0 | 0 | 0 | -7.64 | 322.41 | -20.10 | 125.19 | 0.4186 | |
| 0 | 1 | 0 | 1 | -6.43 | 322.38 | -20.14 | 122.70 | 0.4083 | |
| 0 | 4 | 0 | 2 | -10.15 | 320.37 | -22.15 | 127.13 | 0.4674 | |
| 1 | 30 | 1 | 16 | -7.95 | 321.15 | -21.37 | 124.13 | 0.4378 | |
| 0 | 5 | 0 | 3 | -7.42 | 321.22 | -21.30 | 123.20 | 0.4322 | |
| 0 | 2 | 0 | 1 | -7.31 | 321.03 | -21.48 | 122.75 | 0.4338 | |
| 0 | 0 | 0 | 0 | -8.36 | 320.42 | -22.08 | 124.01 | 0.4505 | |
| 0 | 3 | 0 | 1 | -9.13 | 319.81 | -22.69 | 124.68 | 0.4650 | |
| 1 | 5 | 1 | 3 | -8.19 | 319.59 | -22.93 | 122.68 | 0.4600 | |
| 0 | 1 | 0 | 1 | -8.56 | 319.20 | -23.31 | 122.93 | 0.4681 | |
| 0 | 4 | 0 | 2 | -7.50 | 319.19 | -23.32 | 120.95 | 0.4596 | |
| 0 | 3 | 0 | 2 | -7.89 | 318.97 | -23.55 | 121.43 | 0.4657 | |
| 0 | 4 | 0 | 2 | -7.98 | 318.53 | -23.98 | 121.14 | 0.4721 | |
| 2 | 30 | 1 | 17 | -7.36 | 318.71 | -23.80 | 120.18 | 0.4649 | |
| 0 | 4 | 0 | 2 | -11.12 | 315.69 | -26.83 | 123.53 | 0.5333 | |
| 1 | -22 | 1 | -22 | -7.24 | 317.95 | -24.57 | 119.16 | 0.4743 | |
| 0 | 1 | 0 | 1 | -10.38 | 315.81 | -26.70 | 122.45 | 0.5259 | |
| 0 | 6 | 0 | 3 | -9.33 | 316.13 | -26.39 | 121.03 | 0.5139 | |
| 0 | 1 | 0 | 0 | -11.19 | 314.64 | -27.87 | 122.63 | 0.5466 | |
| 3 | 109 | 2 | 63 | -9.46 | 315.59 | -26.93 | 120.73 | 0.5217 | |
| 0 | 1 | 0 | 0 | -10.86 | 314.40 | -28.10 | 121.89 | 0.5470 | |
| 0 | 1 | 0 | 1 | -10.48 | 314.52 | -27.99 | 121.39 | 0.5427 | |
| 3 | -28 | 2 | -28 | -8.62 | 315.25 | -27.27 | 119.00 | 0.5200 | |
| 1 | 12 | 0 | 7 | -7.47 | 315.45 | -27.07 | 117.18 | 0.5092 | |
| 0 | 2 | 0 | 1 | -8.51 | 314.54 | -27.97 | 118.18 | 0.5284 | |
| 0 | 1 | 0 | 0 | -8.17 | 314.56 | -27.95 | 117.61 | 0.5257 | |
| 0 | 13 | 0 | 8 | -8.57 | 314.12 | -28.39 | 117.92 | 0.5342 | |
| 0 | 43 | 0 | 25 | -7.73 | 314.63 | -27.89 | 116.93 | 0.5219 | |
| 0 | -36 | 0 | -36 | -7.44 | 314.72 | -27.79 | 116.51 | 0.5188 | |
| 0 | 2 | 0 | 1 | -8.66 | 313.71 | -28.80 | 117.71 | 0.5401 | |
| 0 | 2 | 0 | 1 | -8.38 | 313.87 | -28.64 | 117.40 | 0.5361 | |
| 1 | -36 | 0 | -36 | -7.29 | 314.46 | -28.06 | 116.03 | 0.5213 | |
| 3 | -36 | 2 | -36 | -7.63 | 314.17 | -28.34 | 116.38 | 0.5273 | |
| 0 | 4 | 0 | 2 | -8.18 | 313.55 | -28.95 | 116.81 | 0.5389 | |
| 0 | 1 | 0 | 1 | -8.41 | 313.38 | -29.12 | 117.04 | 0.5426 | |
| 0 | 2 | 0 | 1 | -8.59 | 313.20 | -29.31 | 117.19 | 0.5462 | |
| 0 | 2 | 0 | 1 | -7.78 | 312.66 | -29.85 | 115.42 | 0.5482 | |
| 0 | 1 | 0 | 0 | -7.56 | 312.59 | -29.93 | 114.99 | 0.5479 | |
| 0 | 1 | 0 | 1 | -10.31 | 310.77 | -31.74 | 117.99 | 0.5883 | |
| 0 | 1 | 0 | 0 | -9.59 | 310.81 | -31.70 | 116.91 | 0.5832 | |
| 0 | 1 | 0 | 1 | -8.98 | 310.44 | -32.06 | 115.70 | 0.5840 | |
| 0 | 9 | 0 | 5 | -5.65 | 312.34 | -30.16 | 111.58 | 0.5398 | |
| Proj. U | - Projected umbra area in millionths of solar disc, negative values indicate | |
|
that the umbra consists of fragmented regions which cannot be separated without losing umbral area. In this way several spots (intensity minima in the umbra) have a common umbra, e.g. -2 means that the given spot shares an umbra with spot No.2, and the common U value is indicated at spot No.2. |
||
| Proj. WS | - Projected whole spot area in millionths of solar disc, negative values indicate | |
|
that several umbras have a common penumbra, e.g. -7 means that the given umbra shares a penumbra with umbra No.7, and the WS value is indicated at No.7. |
||
| Corr. U | - Corrected umbra area in millionths of solar hemisphere, for negative values see above | |
| Corr. WS | - Corrected whole spot area in millionths of solar hemisphere, for negative values see above | |
| B | - Heliographic latitude B; positive: North, negative: South | |
| L | - Heliographic longitude L | |
| LCM | - Longitudinal distance from the Sun's central meridian | |
| Pos. angle | - Position angle | |
| r | - Distance from the centre of Sun's disc in terms of Sun's radius | |