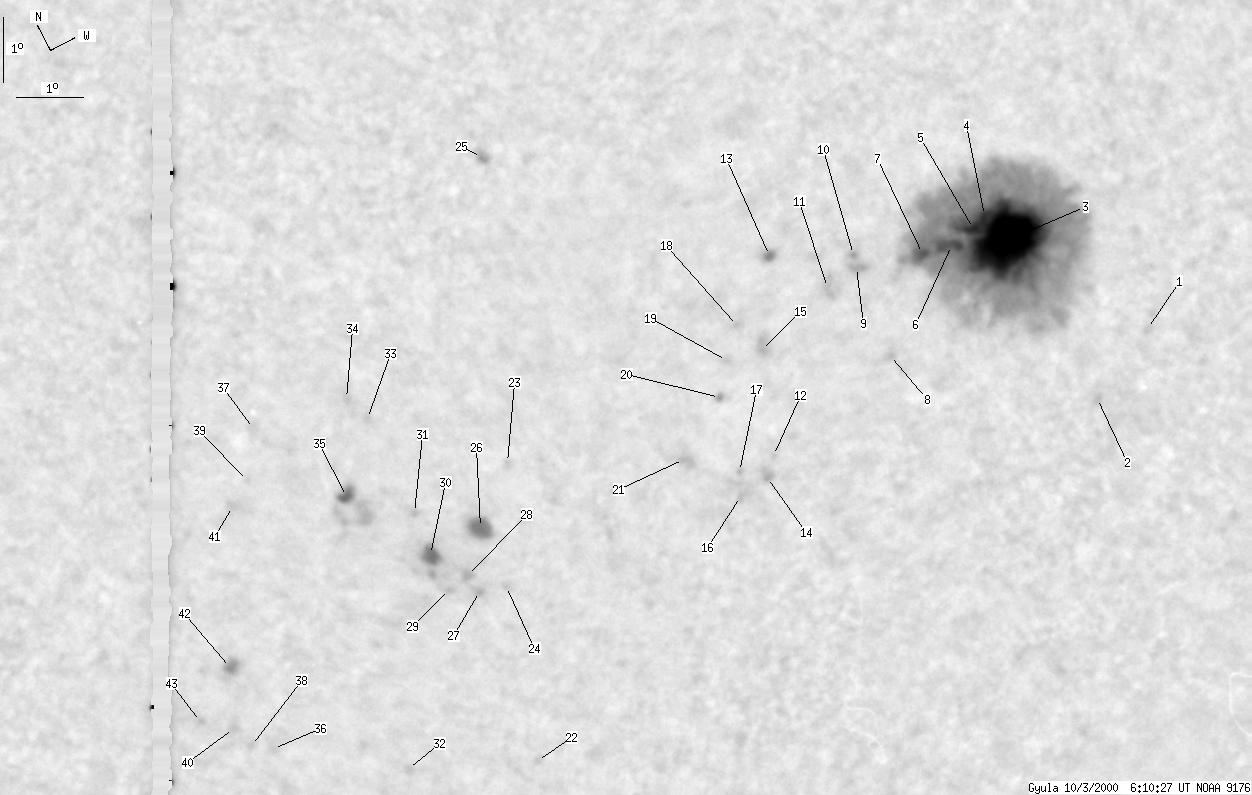
Gyula 2000-10-03 06:07:57 UT
| group | Proj. U | Proj. WS | Corr. U | Corr. WS | B | L | LCM | Pos. angle | r |
| 76 | 638 | 38 | 327 | -8.08 | 323.67 | 3.35 | 192.69 | 0.2678 | |
|
previous
or next day for the same group /
back to the solar disc Gyula 2000-10-03 06:07:57 UT |
| spot | Proj. U | Proj. WS | Corr. U | Corr. WS | B | L | LCM | Pos. angle | r |
| 0 | 1 | 0 | 1 | -10.39 | 326.66 | 6.36 | 200.49 | 0.3125 | |
| 0 | 1 | 0 | 1 | -11.03 | 325.49 | 5.19 | 196.36 | 0.3164 | |
| 54 | 533 | 28 | 274 | -8.13 | 325.23 | 4.91 | 198.48 | 0.2687 | |
| 3 | -3 | 1 | -3 | -7.60 | 325.08 | 4.77 | 198.60 | 0.2595 | |
| 3 | -3 | 2 | -3 | -7.72 | 324.84 | 4.53 | 197.58 | 0.2601 | |
| 3 | -3 | 1 | -3 | -7.86 | 324.44 | 4.13 | 195.96 | 0.2604 | |
| 2 | -3 | 1 | -3 | -7.70 | 323.94 | 3.62 | 194.24 | 0.2556 | |
| 0 | 1 | 0 | 0 | -8.93 | 322.79 | 2.48 | 189.07 | 0.2721 | |
| 0 | 3 | 0 | 1 | -7.47 | 322.94 | 2.62 | 190.59 | 0.2482 | |
| 0 | 1 | 0 | 1 | -7.26 | 323.04 | 2.72 | 191.15 | 0.2449 | |
| 0 | 4 | 0 | 2 | -7.55 | 322.42 | 2.11 | 188.49 | 0.2481 | |
| 0 | 1 | 0 | 0 | -9.54 | 320.57 | 0.27 | 180.96 | 0.2792 | |
| 0 | 2 | 0 | 1 | -6.70 | 321.78 | 1.46 | 186.29 | 0.2324 | |
| 0 | 2 | 0 | 1 | -9.81 | 320.27 | -0.04 | 179.85 | 0.2836 | |
| 0 | 4 | 0 | 2 | -7.95 | 321.08 | 0.76 | 182.99 | 0.2525 | |
| 0 | 2 | 0 | 1 | -9.90 | 319.84 | -0.47 | 178.38 | 0.2852 | |
| 0 | 1 | 0 | 0 | -9.55 | 319.88 | -0.43 | 178.46 | 0.2793 | |
| 0 | 1 | 0 | 1 | -7.49 | 320.88 | 0.56 | 182.28 | 0.2445 | |
| 0 | 2 | 0 | 1 | -7.84 | 320.45 | 0.13 | 180.53 | 0.2504 | |
| 0 | 1 | 0 | 0 | -8.34 | 320.11 | -0.20 | 179.22 | 0.2589 | |
| 0 | 3 | 0 | 2 | -8.97 | 319.24 | -1.08 | 176.03 | 0.2701 | |
| 0 | 1 | 0 | 0 | -12.29 | 315.17 | -5.14 | 164.85 | 0.3362 | |
| 0 | 1 | 0 | 0 | -7.80 | 316.85 | -3.45 | 166.49 | 0.2566 | |
| 0 | 1 | 0 | 1 | -9.52 | 315.89 | -4.43 | 164.63 | 0.2888 | |
| 0 | 3 | 0 | 1 | -3.40 | 318.48 | -1.84 | 169.54 | 0.1771 | |
| 5 | 10 | 2 | 5 | -8.49 | 315.95 | -4.37 | 163.85 | 0.2718 | |
| 0 | 3 | 0 | 1 | -9.45 | 315.56 | -4.74 | 163.54 | 0.2890 | |
| 0 | 2 | 0 | 1 | -9.11 | 315.45 | -4.87 | 162.77 | 0.2842 | |
| 0 | 1 | 0 | 1 | -9.16 | 315.08 | -5.23 | 161.62 | 0.2868 | |
| 4 | 11 | 2 | 6 | -8.57 | 315.09 | -5.23 | 160.95 | 0.2774 | |
| 0 | 2 | 0 | 1 | -7.88 | 315.22 | -5.08 | 160.62 | 0.2656 | |
| 0 | 1 | 0 | 0 | -11.51 | 313.31 | -6.99 | 158.96 | 0.3335 | |
| 0 | 0 | 0 | 0 | -6.26 | 315.17 | -5.15 | 158.11 | 0.2402 | |
| 0 | 2 | 0 | 1 | -5.84 | 315.01 | -5.31 | 156.80 | 0.2347 | |
| 2 | 23 | 1 | 12 | -7.19 | 314.34 | -5.98 | 156.49 | 0.2602 | |
| 0 | 2 | 0 | 1 | -10.30 | 311.58 | -8.72 | 152.73 | 0.3269 | |
| 0 | 3 | 0 | 2 | -5.60 | 313.59 | -6.71 | 151.06 | 0.2416 | |
| 0 | 1 | 0 | 1 | -10.12 | 311.26 | -9.06 | 151.55 | 0.3268 | |
| 0 | 1 | 0 | 0 | -6.30 | 313.14 | -7.16 | 150.86 | 0.2555 | |
| 0 | 1 | 0 | 1 | -9.73 | 311.10 | -9.21 | 150.56 | 0.3225 | |
| 0 | 2 | 0 | 1 | -6.55 | 312.73 | -7.59 | 149.91 | 0.2628 | |
| 0 | 3 | 0 | 2 | -8.86 | 311.53 | -8.79 | 150.34 | 0.3063 | |
| 0 | 1 | 0 | 0 | -9.42 | 310.77 | -9.53 | 149.22 | 0.3206 | |
| Proj. U | - Projected umbra area in millionths of solar disc, negative values indicate | |
|
that the umbra consists of fragmented regions which cannot be separated without losing umbral area. In this way several spots (intensity minima in the umbra) have a common umbra, e.g. -2 means that the given spot shares an umbra with spot No.2, and the common U value is indicated at spot No.2. |
||
| Proj. WS | - Projected whole spot area in millionths of solar disc, negative values indicate | |
|
that several umbras have a common penumbra, e.g. -7 means that the given umbra shares a penumbra with umbra No.7, and the WS value is indicated at No.7. |
||
| Corr. U | - Corrected umbra area in millionths of solar hemisphere, for negative values see above | |
| Corr. WS | - Corrected whole spot area in millionths of solar hemisphere, for negative values see above | |
| B | - Heliographic latitude B; positive: North, negative: South | |
| L | - Heliographic longitude L | |
| LCM | - Longitudinal distance from the Sun's central meridian | |
| Pos. angle | - Position angle | |
| r | - Distance from the centre of Sun's disc in terms of Sun's radius | |