Gyula 2000-10-16 09:17:25 UT
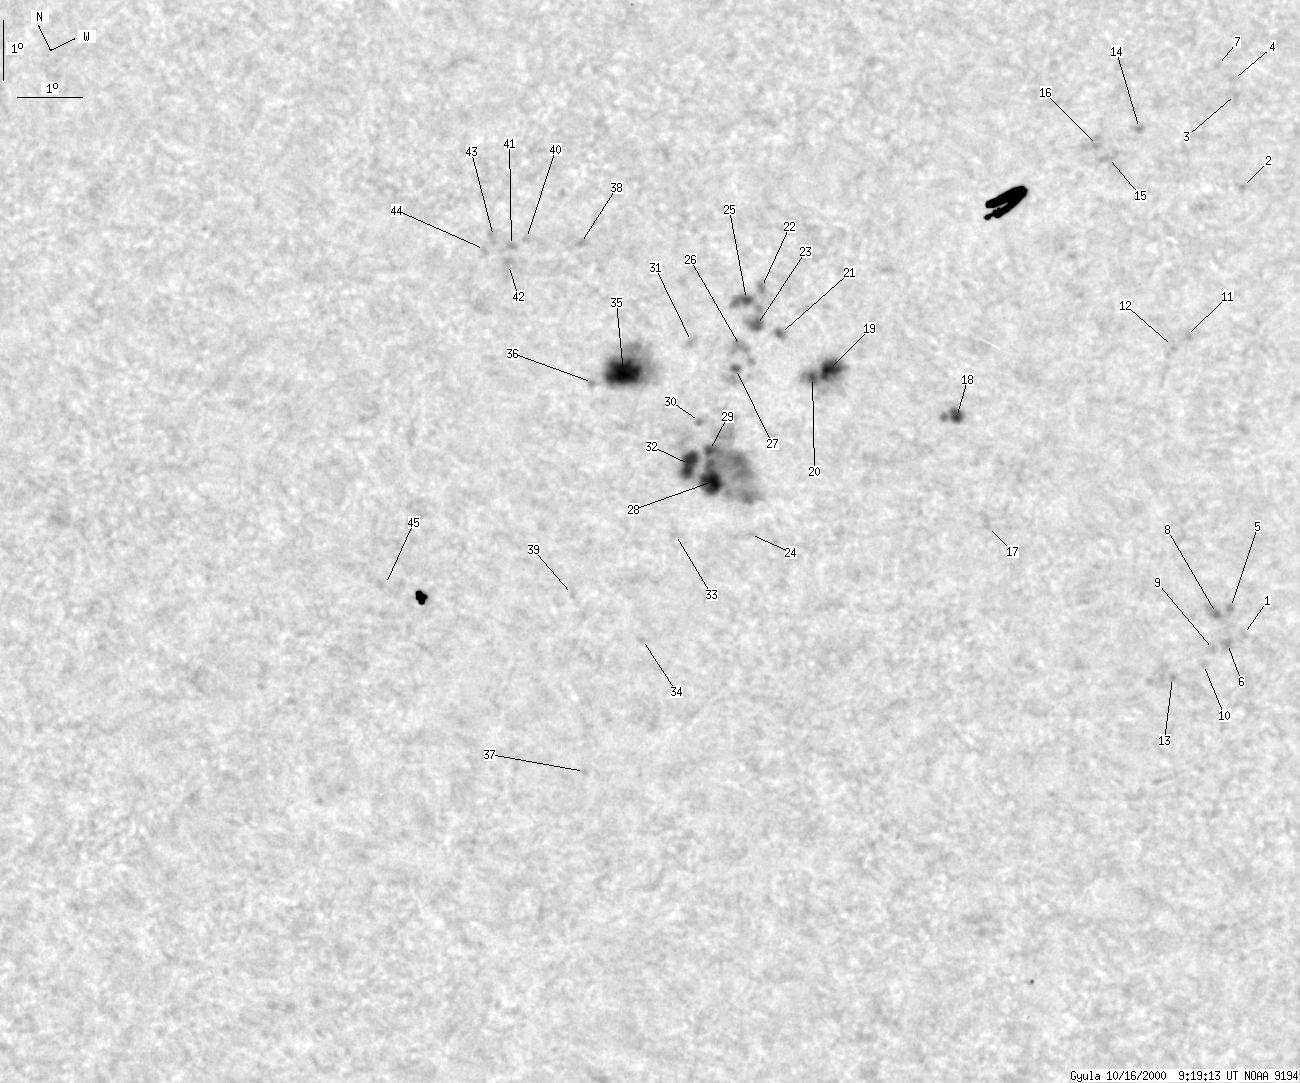
| group | Proj. U | Proj. WS | Corr. U | Corr. WS | B | L | LCM | Pos. angle | r |
| 38 | 325 | 18 | 179 | -11.98 | 129.98 | -17.10 | 136.43 | 0.4202 | |
|
previous
or next day for the same group /
back to the solar disc Gyula 2000-10-16 09:17:25 UT |
| spot | Proj. U | Proj. WS | Corr. U | Corr. WS | B | L | LCM | Pos. angle | r |
| 0 | 3 | 0 | 2 | -11.73 | 138.18 | -8.88 | 153.17 | 0.3365 | |
| 0 | 1 | 0 | 1 | -18.33 | 134.73 | -12.34 | 153.44 | 0.4554 | |
| 0 | 1 | 0 | 1 | -10.36 | 138.71 | -8.35 | 152.64 | 0.3124 | |
| 0 | 1 | 0 | 1 | -10.08 | 138.80 | -8.27 | 152.47 | 0.3076 | |
| 0 | 1 | 0 | 1 | -17.83 | 134.77 | -12.30 | 152.98 | 0.4483 | |
| 0 | 3 | 0 | 2 | -18.35 | 134.43 | -12.64 | 152.91 | 0.4579 | |
| 0 | 2 | 0 | 1 | -9.79 | 138.68 | -8.38 | 151.70 | 0.3043 | |
| 0 | 3 | 0 | 1 | -17.82 | 134.52 | -12.55 | 152.51 | 0.4500 | |
| 0 | 1 | 0 | 1 | -18.33 | 134.17 | -12.89 | 152.42 | 0.4594 | |
| 0 | 2 | 0 | 1 | -18.51 | 133.91 | -13.15 | 152.14 | 0.4637 | |
| 0 | 4 | 0 | 2 | -13.50 | 136.32 | -10.75 | 151.04 | 0.3763 | |
| 0 | 4 | 0 | 2 | -13.56 | 136.00 | -11.07 | 150.41 | 0.3797 | |
| 1 | 13 | 0 | 7 | -18.49 | 133.36 | -13.71 | 151.14 | 0.4675 | |
| 0 | 3 | 0 | 2 | -10.15 | 137.15 | -9.93 | 148.07 | 0.3223 | |
| 0 | 3 | 0 | 2 | -10.39 | 136.51 | -10.56 | 146.87 | 0.3313 | |
| 0 | 7 | 0 | 4 | -10.11 | 136.49 | -10.59 | 146.32 | 0.3277 | |
| 0 | 3 | 0 | 2 | -14.88 | 132.00 | -15.07 | 144.23 | 0.4317 | |
| 3 | 9 | 1 | 5 | -13.12 | 132.43 | -14.66 | 142.42 | 0.4058 | |
| 3 | 27 | 2 | 15 | -11.63 | 131.03 | -16.06 | 137.42 | 0.4021 | |
| 1 | -19 | 0 | -19 | -11.63 | 130.74 | -16.34 | 136.91 | 0.4052 | |
| 1 | 5 | 0 | 3 | -10.80 | 130.62 | -16.46 | 135.24 | 0.3971 | |
| 0 | 2 | 0 | 1 | -10.05 | 130.71 | -16.37 | 134.01 | 0.3876 | |
| 1 | 17 | 1 | 9 | -10.52 | 130.35 | -16.74 | 134.25 | 0.3970 | |
| 0 | 2 | 0 | 1 | -13.54 | 128.55 | -18.53 | 136.46 | 0.4504 | |
| 1 | -23 | 0 | -23 | -10.08 | 130.39 | -16.69 | 133.52 | 0.3917 | |
| 1 | 12 | 1 | 6 | -10.74 | 129.94 | -17.14 | 133.98 | 0.4041 | |
| 1 | 11 | 0 | 6 | -11.03 | 129.73 | -17.36 | 134.14 | 0.4097 | |
| 7 | 98 | 4 | 54 | -12.54 | 128.43 | -18.66 | 134.65 | 0.4408 | |
| 0 | -28 | 0 | -28 | -12.08 | 128.67 | -18.42 | 134.26 | 0.4332 | |
| 0 | 1 | 0 | 1 | -11.56 | 128.79 | -18.30 | 133.56 | 0.4263 | |
| 0 | 6 | 0 | 3 | -10.33 | 129.28 | -17.80 | 132.15 | 0.4073 | |
| 5 | -28 | 2 | -28 | -12.10 | 128.30 | -18.78 | 133.74 | 0.4375 | |
| 0 | 2 | 0 | 1 | -13.06 | 127.46 | -19.61 | 134.08 | 0.4570 | |
| 0 | 2 | 0 | 1 | -14.40 | 126.08 | -20.99 | 134.25 | 0.4862 | |
| 13 | 48 | 7 | 26 | -10.35 | 128.05 | -19.03 | 130.27 | 0.4223 | |
| 0 | 2 | 0 | 1 | -10.32 | 127.56 | -19.52 | 129.50 | 0.4279 | |
| 0 | 1 | 0 | 1 | -16.00 | 124.05 | -23.02 | 133.98 | 0.5245 | |
| 0 | 2 | 0 | 1 | -8.21 | 128.50 | -18.58 | 126.81 | 0.3956 | |
| 0 | 1 | 0 | 0 | -13.28 | 125.46 | -21.61 | 131.68 | 0.4819 | |
| 0 | 1 | 0 | 1 | -7.82 | 127.70 | -19.36 | 124.86 | 0.4020 | |
| 0 | 2 | 0 | 1 | -7.85 | 127.48 | -19.60 | 124.59 | 0.4054 | |
| 0 | 5 | 0 | 2 | -8.08 | 127.30 | -19.78 | 124.81 | 0.4099 | |
| 0 | 4 | 0 | 2 | -7.58 | 127.25 | -19.82 | 123.74 | 0.4060 | |
| 0 | 1 | 0 | 0 | -7.71 | 127.02 | -20.05 | 123.70 | 0.4102 | |
| 0 | 9 | 0 | 5 | -11.95 | 122.81 | -24.26 | 126.30 | 0.5008 | |
| Proj. U | - Projected umbra area in millionths of solar disc, negative values indicate | |
|
that the umbra consists of fragmented regions which cannot be separated without losing umbral area. In this way several spots (intensity minima in the umbra) have a common umbra, e.g. -2 means that the given spot shares an umbra with spot No.2, and the common U value is indicated at spot No.2. |
||
| Proj. WS | - Projected whole spot area in millionths of solar disc, negative values indicate | |
|
that several umbras have a common penumbra, e.g. -7 means that the given umbra shares a penumbra with umbra No.7, and the WS value is indicated at No.7. |
||
| Corr. U | - Corrected umbra area in millionths of solar hemisphere, for negative values see above | |
| Corr. WS | - Corrected whole spot area in millionths of solar hemisphere, for negative values see above | |
| B | - Heliographic latitude B; positive: North, negative: South | |
| L | - Heliographic longitude L | |
| LCM | - Longitudinal distance from the Sun's central meridian | |
| Pos. angle | - Position angle | |
| r | - Distance from the centre of Sun's disc in terms of Sun's radius | |