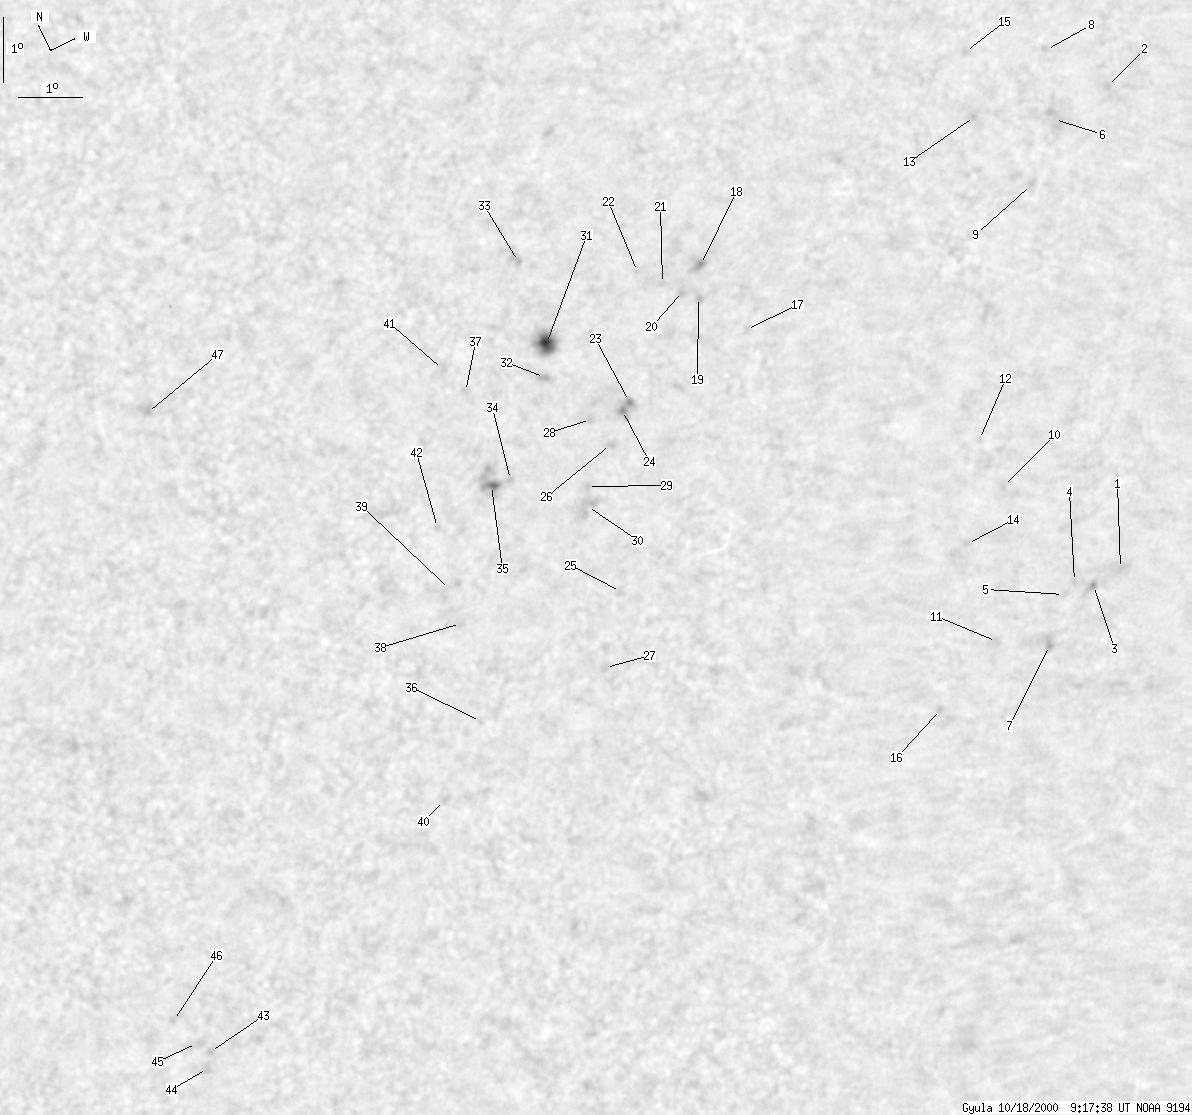
Gyula 2000-10-18 09:19:06 UT
| group | Proj. U | Proj. WS | Corr. U | Corr. WS | B | L | LCM | Pos. angle | r |
| 8 | 122 | 4 | 64 | -12.38 | 128.88 | 8.18 | 203.93 | 0.3467 | |
|
previous
or next day for the same group /
back to the solar disc Gyula 2000-10-18 09:19:06 UT |
| spot | Proj. U | Proj. WS | Corr. U | Corr. WS | B | L | LCM | Pos. angle | r |
| 0 | 2 | 0 | 1 | -17.41 | 134.85 | 14.15 | 211.02 | 0.4545 | |
| 0 | 1 | 0 | 1 | -10.36 | 137.48 | 16.78 | 226.38 | 0.3939 | |
| 0 | 2 | 0 | 1 | -17.45 | 134.33 | 13.64 | 210.07 | 0.4510 | |
| 0 | 1 | 0 | 1 | -17.27 | 134.07 | 13.36 | 209.77 | 0.4464 | |
| 0 | 2 | 0 | 1 | -17.38 | 133.82 | 13.12 | 209.19 | 0.4461 | |
| 0 | 7 | 0 | 4 | -10.45 | 136.49 | 15.78 | 224.46 | 0.3836 | |
| 0 | 2 | 0 | 1 | -18.04 | 133.31 | 12.61 | 207.52 | 0.4512 | |
| 0 | 2 | 0 | 1 | -9.41 | 136.77 | 16.08 | 226.99 | 0.3754 | |
| 0 | 3 | 0 | 2 | -11.22 | 135.77 | 15.08 | 221.76 | 0.3849 | |
| 0 | 1 | 0 | 1 | -15.36 | 133.54 | 12.84 | 211.11 | 0.4165 | |
| 0 | 1 | 0 | 0 | -17.59 | 132.52 | 11.82 | 206.50 | 0.4394 | |
| 0 | 1 | 0 | 1 | -14.50 | 133.46 | 12.75 | 212.07 | 0.4043 | |
| 0 | 3 | 0 | 1 | -9.84 | 135.30 | 14.61 | 223.39 | 0.3634 | |
| 0 | 1 | 0 | 1 | -15.93 | 132.66 | 11.96 | 208.64 | 0.4174 | |
| 0 | 1 | 0 | 1 | -8.86 | 135.58 | 14.88 | 225.85 | 0.3551 | |
| 0 | 1 | 0 | 0 | -18.20 | 131.27 | 10.57 | 203.45 | 0.4397 | |
| 0 | 3 | 0 | 1 | -11.28 | 130.69 | 9.98 | 210.50 | 0.3364 | |
| 1 | 5 | 1 | 2 | -10.03 | 130.38 | 9.69 | 211.74 | 0.3164 | |
| 0 | 1 | 0 | 1 | -10.50 | 130.17 | 9.47 | 210.41 | 0.3212 | |
| 0 | 2 | 0 | 1 | -10.29 | 129.99 | 9.29 | 210.26 | 0.3167 | |
| 0 | 1 | 0 | 1 | -10.04 | 129.76 | 9.05 | 210.02 | 0.3111 | |
| 0 | 1 | 0 | 0 | -9.70 | 129.47 | 8.77 | 209.80 | 0.3038 | |
| 0 | 3 | 0 | 1 | -11.51 | 128.53 | 7.84 | 204.51 | 0.3235 | |
| 0 | 3 | 0 | 1 | -11.59 | 128.36 | 7.68 | 203.97 | 0.3236 | |
| 0 | 3 | 0 | 2 | -14.18 | 127.24 | 6.54 | 198.13 | 0.3567 | |
| 0 | 4 | 0 | 2 | -11.98 | 128.01 | 7.31 | 202.47 | 0.3272 | |
| 0 | 2 | 0 | 1 | -15.18 | 126.55 | 5.85 | 195.53 | 0.3691 | |
| 0 | 1 | 0 | 1 | -11.48 | 127.88 | 7.18 | 202.70 | 0.3188 | |
| 0 | 1 | 0 | 0 | -12.43 | 127.42 | 6.72 | 200.32 | 0.3305 | |
| 0 | 6 | 0 | 3 | -12.72 | 127.30 | 6.60 | 199.67 | 0.3343 | |
| 5 | 16 | 2 | 8 | -10.09 | 127.69 | 7.00 | 203.99 | 0.2964 | |
| 0 | 2 | 0 | 1 | -10.55 | 127.45 | 6.77 | 202.68 | 0.3019 | |
| 0 | 2 | 0 | 1 | -8.73 | 127.80 | 7.11 | 206.40 | 0.2764 | |
| 0 | 1 | 0 | 1 | -11.80 | 126.36 | 5.66 | 197.94 | 0.3149 | |
| 2 | 11 | 1 | 6 | -11.73 | 126.01 | 5.32 | 196.99 | 0.3121 | |
| 0 | 1 | 0 | 1 | -15.10 | 124.40 | 3.70 | 190.01 | 0.3601 | |
| 0 | 2 | 0 | 1 | -10.23 | 126.27 | 5.57 | 199.35 | 0.2897 | |
| 0 | 2 | 0 | 1 | -13.53 | 124.74 | 4.04 | 191.81 | 0.3359 | |
| 0 | 5 | 0 | 2 | -12.96 | 124.80 | 4.10 | 192.35 | 0.3269 | |
| 0 | 1 | 0 | 1 | -16.02 | 123.38 | 2.67 | 186.95 | 0.3724 | |
| 0 | 3 | 0 | 1 | -9.76 | 126.09 | 5.39 | 199.29 | 0.2812 | |
| 0 | 1 | 0 | 1 | -11.99 | 125.02 | 4.32 | 193.72 | 0.3119 | |
| 0 | 1 | 0 | 0 | -18.14 | 118.32 | -2.38 | 174.40 | 0.4059 | |
| 0 | 1 | 0 | 1 | -18.38 | 118.16 | -2.54 | 174.09 | 0.4099 | |
| 0 | 4 | 0 | 2 | -17.92 | 118.18 | -2.52 | 174.00 | 0.4027 | |
| 0 | 0 | 0 | 0 | -17.42 | 118.01 | -2.69 | 173.45 | 0.3949 | |
| 0 | 2 | 0 | 1 | -8.40 | 121.68 | 0.97 | 183.98 | 0.2433 | |
| Proj. U | - Projected umbra area in millionths of solar disc, negative values indicate | |
|
that the umbra consists of fragmented regions which cannot be separated without losing umbral area. In this way several spots (intensity minima in the umbra) have a common umbra, e.g. -2 means that the given spot shares an umbra with spot No.2, and the common U value is indicated at spot No.2. |
||
| Proj. WS | - Projected whole spot area in millionths of solar disc, negative values indicate | |
|
that several umbras have a common penumbra, e.g. -7 means that the given umbra shares a penumbra with umbra No.7, and the WS value is indicated at No.7. |
||
| Corr. U | - Corrected umbra area in millionths of solar hemisphere, for negative values see above | |
| Corr. WS | - Corrected whole spot area in millionths of solar hemisphere, for negative values see above | |
| B | - Heliographic latitude B; positive: North, negative: South | |
| L | - Heliographic longitude L | |
| LCM | - Longitudinal distance from the Sun's central meridian | |
| Pos. angle | - Position angle | |
| r | - Distance from the centre of Sun's disc in terms of Sun's radius | |