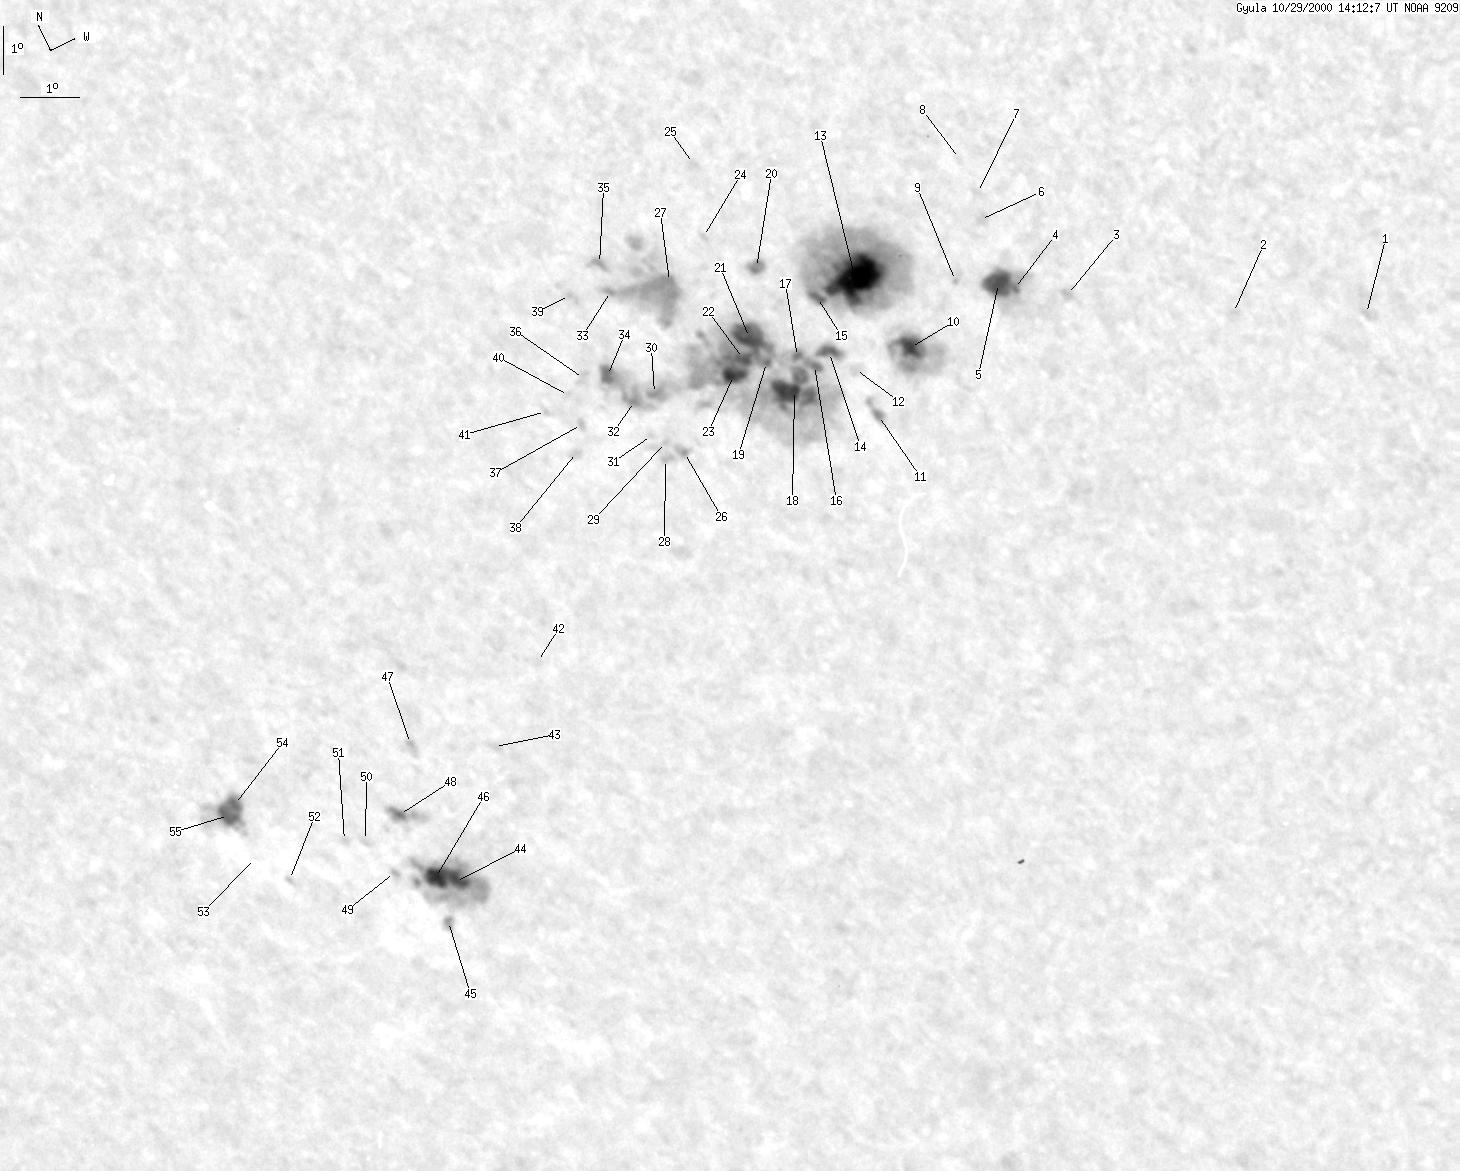
Gyula 2000-10-29 14:07:53 UT
| group | Proj. U | Proj. WS | Corr. U | Corr. WS | B | L | LCM | Pos. angle | r |
| 127 | 970 | 82 | 625 | -23.54 | 304.25 | -28.72 | 136.74 | 0.6390 | |
|
previous
or next day for the same group /
back to the solar disc Gyula 2000-10-29 14:07:53 UT |
| spot | Proj. U | Proj. WS | Corr. U | Corr. WS | B | L | LCM | Pos. angle | r |
| 0 | 2 | 0 | 1 | -26.14 | 315.29 | -17.66 | 151.77 | 0.5782 | |
| 0 | 2 | 0 | 1 | -25.16 | 313.31 | -19.63 | 148.29 | 0.5806 | |
| 0 | 2 | 0 | 1 | -23.90 | 310.91 | -22.06 | 143.95 | 0.5856 | |
| 1 | 31 | 0 | 19 | -23.45 | 310.23 | -22.74 | 142.62 | 0.5864 | |
| 10 | -4 | 6 | -4 | -23.22 | 310.06 | -22.92 | 142.16 | 0.5855 | |
| 0 | 5 | 0 | 3 | -22.08 | 310.45 | -22.53 | 141.30 | 0.5700 | |
| 0 | 1 | 0 | 1 | -21.63 | 310.62 | -22.34 | 140.99 | 0.5635 | |
| 0 | 2 | 0 | 1 | -20.94 | 310.69 | -22.25 | 140.26 | 0.5553 | |
| 0 | 1 | 0 | 1 | -22.87 | 309.45 | -23.53 | 141.04 | 0.5872 | |
| 5 | 59 | 3 | 37 | -23.65 | 308.01 | -24.96 | 140.34 | 0.6080 | |
| 1 | 6 | 0 | 4 | -24.53 | 306.80 | -26.18 | 140.04 | 0.6273 | |
| 0 | 5 | 0 | 3 | -23.65 | 306.93 | -26.02 | 139.21 | 0.6174 | |
| 34 | 204 | 21 | 125 | -22.22 | 307.91 | -25.06 | 138.55 | 0.5946 | |
| 5 | 401 | 3 | 254 | -23.25 | 306.71 | -26.26 | 138.49 | 0.6157 | |
| 2 | -13 | 1 | -13 | -22.27 | 307.13 | -25.85 | 137.76 | 0.6025 | |
| 2 | -14 | 1 | -14 | -23.29 | 306.36 | -26.58 | 138.21 | 0.6189 | |
| 2 | -14 | 1 | -14 | -23.08 | 306.20 | -26.77 | 137.75 | 0.6187 | |
| 18 | -14 | 11 | -14 | -23.61 | 305.70 | -27.27 | 137.87 | 0.6283 | |
| 1 | -14 | 1 | -14 | -22.94 | 305.65 | -27.29 | 137.07 | 0.6222 | |
| 3 | 9 | 2 | 6 | -21.40 | 306.61 | -26.37 | 136.15 | 0.5991 | |
| 11 | -14 | 7 | -14 | -22.53 | 305.73 | -27.25 | 136.62 | 0.6181 | |
| 2 | -14 | 2 | -14 | -22.77 | 305.37 | -27.61 | 136.56 | 0.6237 | |
| 4 | -14 | 3 | -14 | -22.96 | 305.04 | -27.93 | 136.45 | 0.6284 | |
| 0 | 1 | 0 | 1 | -20.61 | 306.04 | -26.93 | 134.57 | 0.5973 | |
| 0 | 0 | 0 | 0 | -19.34 | 306.67 | -26.30 | 133.57 | 0.5793 | |
| 0 | 3 | 0 | 2 | -23.94 | 303.36 | -29.61 | 136.01 | 0.6527 | |
| 0 | 93 | 0 | 58 | -21.08 | 304.96 | -27.99 | 134.10 | 0.6121 | |
| 0 | 2 | 0 | 1 | -23.94 | 302.91 | -30.07 | 135.61 | 0.6569 | |
| 0 | 1 | 0 | 1 | -23.67 | 303.20 | -29.77 | 135.55 | 0.6518 | |
| 1 | -14 | 1 | -14 | -22.83 | 303.58 | -29.39 | 134.91 | 0.6410 | |
| 0 | 2 | 0 | 1 | -23.46 | 303.02 | -29.95 | 135.14 | 0.6517 | |
| 1 | -14 | 1 | -14 | -22.73 | 303.14 | -29.80 | 134.42 | 0.6440 | |
| 1 | -27 | 1 | -27 | -20.88 | 304.09 | -28.88 | 132.99 | 0.6193 | |
| 3 | -14 | 2 | -14 | -22.21 | 303.00 | -29.98 | 133.63 | 0.6414 | |
| 2 | 6 | 1 | 4 | -20.37 | 304.20 | -28.77 | 132.44 | 0.6137 | |
| 0 | 5 | 0 | 3 | -22.05 | 302.60 | -30.34 | 133.10 | 0.6435 | |
| 0 | 2 | 0 | 1 | -22.82 | 302.02 | -30.95 | 133.49 | 0.6558 | |
| 0 | 2 | 0 | 1 | -23.25 | 301.60 | -31.36 | 133.65 | 0.6632 | |
| 0 | 2 | 0 | 1 | -20.74 | 303.35 | -29.60 | 132.14 | 0.6253 | |
| 0 | 2 | 0 | 1 | -22.22 | 302.16 | -30.77 | 132.93 | 0.6492 | |
| 0 | 1 | 0 | 0 | -22.42 | 301.60 | -31.35 | 132.66 | 0.6564 | |
| 0 | 1 | 0 | 1 | -26.37 | 298.25 | -34.69 | 134.53 | 0.7176 | |
| 0 | 3 | 0 | 2 | -27.58 | 296.28 | -36.70 | 134.38 | 0.7434 | |
| 12 | 64 | 9 | 50 | -29.67 | 293.44 | -39.54 | 134.68 | 0.7802 | |
| 0 | 2 | 0 | 2 | -30.36 | 292.52 | -40.46 | 134.81 | 0.7915 | |
| -44 | -44 | -44 | -44 | -29.48 | 293.13 | -39.85 | 134.28 | 0.7814 | |
| 0 | 1 | 0 | 1 | -27.00 | 294.89 | -38.09 | 132.77 | 0.7512 | |
| 1 | 10 | 1 | 7 | -28.14 | 293.52 | -39.45 | 133.11 | 0.7698 | |
| 0 | 1 | 0 | 1 | -29.11 | 292.43 | -40.55 | 133.45 | 0.7846 | |
| 0 | 3 | 0 | 3 | -28.33 | 292.50 | -40.43 | 132.69 | 0.7789 | |
| 0 | 2 | 0 | 2 | -28.20 | 292.13 | -40.81 | 132.31 | 0.7812 | |
| 0 | 1 | 0 | 0 | -28.57 | 290.50 | -42.48 | 131.71 | 0.7967 | |
| 0 | 0 | 0 | 0 | -27.96 | 290.29 | -42.69 | 130.93 | 0.7949 | |
| 1 | 30 | 1 | 24 | -26.90 | 290.77 | -42.17 | 130.08 | 0.7847 | |
| 4 | -54 | 3 | -54 | -27.12 | 290.48 | -42.50 | 130.13 | 0.7887 | |
| Proj. U | - Projected umbra area in millionths of solar disc, negative values indicate | |
|
that the umbra consists of fragmented regions which cannot be separated without losing umbral area. In this way several spots (intensity minima in the umbra) have a common umbra, e.g. -2 means that the given spot shares an umbra with spot No.2, and the common U value is indicated at spot No.2. |
||
| Proj. WS | - Projected whole spot area in millionths of solar disc, negative values indicate | |
|
that several umbras have a common penumbra, e.g. -7 means that the given umbra shares a penumbra with umbra No.7, and the WS value is indicated at No.7. |
||
| Corr. U | - Corrected umbra area in millionths of solar hemisphere, for negative values see above | |
| Corr. WS | - Corrected whole spot area in millionths of solar hemisphere, for negative values see above | |
| B | - Heliographic latitude B; positive: North, negative: South | |
| L | - Heliographic longitude L | |
| LCM | - Longitudinal distance from the Sun's central meridian | |
| Pos. angle | - Position angle | |
| r | - Distance from the centre of Sun's disc in terms of Sun's radius | |