Gyula 2000-11-01 09:39:46 UT
| group | Proj. U | Proj. WS | Corr. U | Corr. WS | B | L | LCM | Pos. angle | r |
| 48 | 472 | 27 | 267 | 9.88 | 267.66 | -28.21 | 77.20 | 0.4791 | |
|
previous
or next day for the same group /
back to the solar disc Gyula 2000-11-01 09:39:46 UT |
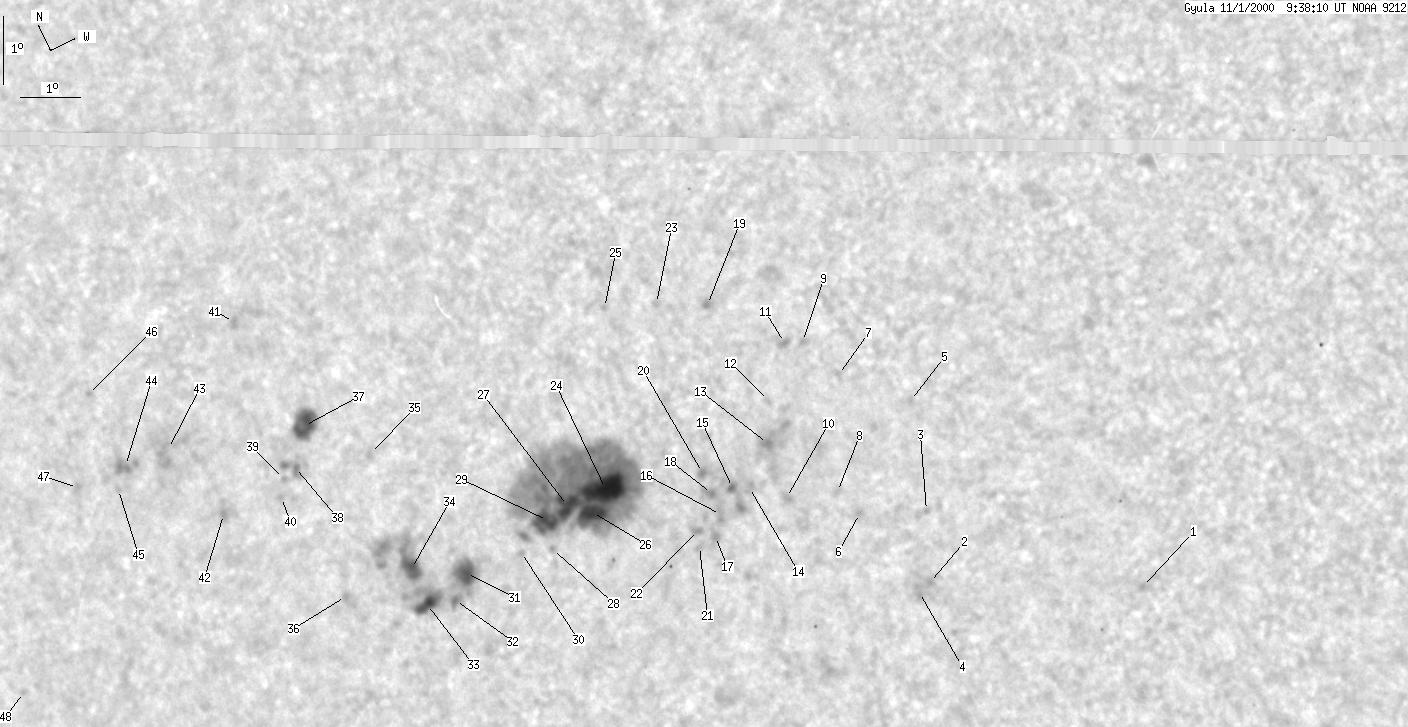
| spot | Proj. U | Proj. WS | Corr. U | Corr. WS | B | L | LCM | Pos. angle | r |
| 0 | 1 | 0 | 0 | 5.33 | 276.63 | -19.25 | 86.14 | 0.3305 | |
| 0 | 1 | 0 | 1 | 6.63 | 273.46 | -22.42 | 83.04 | 0.3834 | |
| 0 | 1 | 0 | 0 | 7.62 | 273.88 | -22.00 | 80.34 | 0.3782 | |
| 0 | 3 | 0 | 1 | 6.54 | 273.24 | -22.65 | 83.33 | 0.3869 | |
| 0 | 0 | 0 | 0 | 9.28 | 274.23 | -21.66 | 75.82 | 0.3773 | |
| 0 | 1 | 0 | 1 | 8.00 | 272.76 | -23.13 | 79.73 | 0.3970 | |
| 0 | 1 | 0 | 0 | 10.06 | 273.26 | -22.63 | 74.37 | 0.3951 | |
| 0 | 3 | 0 | 2 | 8.42 | 272.57 | -23.32 | 78.75 | 0.4010 | |
| 0 | 1 | 0 | 0 | 10.76 | 272.87 | -23.02 | 72.88 | 0.4037 | |
| 0 | 2 | 0 | 1 | 8.63 | 271.73 | -24.15 | 78.55 | 0.4145 | |
| 0 | 1 | 0 | 1 | 10.86 | 272.62 | -23.25 | 72.79 | 0.4076 | |
| 0 | 3 | 0 | 1 | 10.10 | 272.01 | -23.88 | 74.94 | 0.4144 | |
| 1 | 21 | 1 | 12 | 9.47 | 271.77 | -24.10 | 76.53 | 0.4159 | |
| 0 | 2 | 0 | 1 | 9.03 | 271.22 | -24.67 | 77.80 | 0.4235 | |
| 0 | 9 | 0 | 5 | 9.08 | 270.99 | -24.88 | 77.77 | 0.4270 | |
| 0 | 2 | 0 | 1 | 8.76 | 270.67 | -25.20 | 78.61 | 0.4311 | |
| 0 | 1 | 0 | 1 | 8.48 | 270.49 | -25.38 | 79.31 | 0.4333 | |
| 0 | 2 | 0 | 1 | 9.10 | 270.65 | -25.22 | 77.85 | 0.4322 | |
| 0 | 3 | 0 | 1 | 11.81 | 271.63 | -24.24 | 71.18 | 0.4265 | |
| 0 | 1 | 0 | 1 | 9.44 | 270.64 | -25.23 | 77.05 | 0.4333 | |
| 0 | 2 | 0 | 1 | 8.43 | 270.07 | -25.82 | 79.56 | 0.4399 | |
| 0 | 1 | 0 | 1 | 8.66 | 270.22 | -25.65 | 78.99 | 0.4379 | |
| 0 | 2 | 0 | 1 | 12.10 | 270.76 | -25.13 | 71.04 | 0.4408 | |
| 14 | 255 | 8 | 143 | 9.78 | 269.00 | -26.87 | 76.93 | 0.4592 | |
| 0 | 1 | 0 | 1 | 12.34 | 269.89 | -25.99 | 71.03 | 0.4547 | |
| 5 | -24 | 3 | -24 | 9.52 | 268.61 | -27.26 | 77.62 | 0.4644 | |
| 6 | -24 | 3 | -24 | 9.72 | 268.18 | -27.69 | 77.35 | 0.4714 | |
| 0 | 1 | 0 | 1 | 9.20 | 267.65 | -28.22 | 78.59 | 0.4782 | |
| 4 | -24 | 2 | -24 | 9.65 | 267.79 | -28.09 | 77.62 | 0.4772 | |
| 0 | 1 | 0 | 0 | 9.33 | 267.17 | -28.70 | 78.47 | 0.4856 | |
| 5 | 97 | 3 | 56 | 9.37 | 266.17 | -29.70 | 78.67 | 0.5006 | |
| 1 | -31 | 0 | -31 | 9.03 | 265.77 | -30.10 | 79.43 | 0.5059 | |
| 4 | -31 | 2 | -31 | 9.15 | 265.33 | -30.54 | 79.30 | 0.5126 | |
| 4 | -31 | 2 | -31 | 9.75 | 265.23 | -30.64 | 78.16 | 0.5152 | |
| 0 | 2 | 0 | 1 | 11.61 | 265.18 | -30.70 | 74.64 | 0.5207 | |
| 0 | 1 | 0 | 1 | 9.70 | 263.94 | -31.93 | 78.59 | 0.5340 | |
| 4 | 12 | 3 | 7 | 12.43 | 264.24 | -31.64 | 73.44 | 0.5365 | |
| 0 | 4 | 0 | 2 | 11.82 | 263.81 | -32.06 | 74.71 | 0.5408 | |
| 0 | 0 | 0 | 0 | 11.71 | 263.53 | -32.36 | 75.01 | 0.5446 | |
| 0 | 2 | 0 | 1 | 11.45 | 263.39 | -32.50 | 75.52 | 0.5460 | |
| 0 | 1 | 0 | 1 | 14.24 | 263.52 | -32.36 | 70.48 | 0.5526 | |
| 0 | 8 | 0 | 5 | 11.55 | 262.31 | -33.56 | 75.67 | 0.5612 | |
| 0 | 12 | 0 | 7 | 12.80 | 261.67 | -34.20 | 73.70 | 0.5734 | |
| 0 | 8 | 0 | 5 | 12.75 | 260.87 | -35.00 | 74.03 | 0.5841 | |
| 0 | 1 | 0 | 0 | 12.45 | 260.54 | -35.33 | 74.64 | 0.5878 | |
| 0 | 0 | 0 | 0 | 13.99 | 260.48 | -35.40 | 72.08 | 0.5930 | |
| 0 | 1 | 0 | 1 | 12.73 | 259.76 | -36.12 | 74.39 | 0.5993 | |
| 0 | 1 | 0 | 1 | 10.08 | 257.59 | -38.30 | 79.18 | 0.6235 | |
| Proj. U | - Projected umbra area in millionths of solar disc, negative values indicate | |
|
that the umbra consists of fragmented regions which cannot be separated without losing umbral area. In this way several spots (intensity minima in the umbra) have a common umbra, e.g. -2 means that the given spot shares an umbra with spot No.2, and the common U value is indicated at spot No.2. |
||
| Proj. WS | - Projected whole spot area in millionths of solar disc, negative values indicate | |
|
that several umbras have a common penumbra, e.g. -7 means that the given umbra shares a penumbra with umbra No.7, and the WS value is indicated at No.7. |
||
| Corr. U | - Corrected umbra area in millionths of solar hemisphere, for negative values see above | |
| Corr. WS | - Corrected whole spot area in millionths of solar hemisphere, for negative values see above | |
| B | - Heliographic latitude B; positive: North, negative: South | |
| L | - Heliographic longitude L | |
| LCM | - Longitudinal distance from the Sun's central meridian | |
| Pos. angle | - Position angle | |
| r | - Distance from the centre of Sun's disc in terms of Sun's radius | |