Kanzelhoehe 2000-11-02 07:35:48 UT
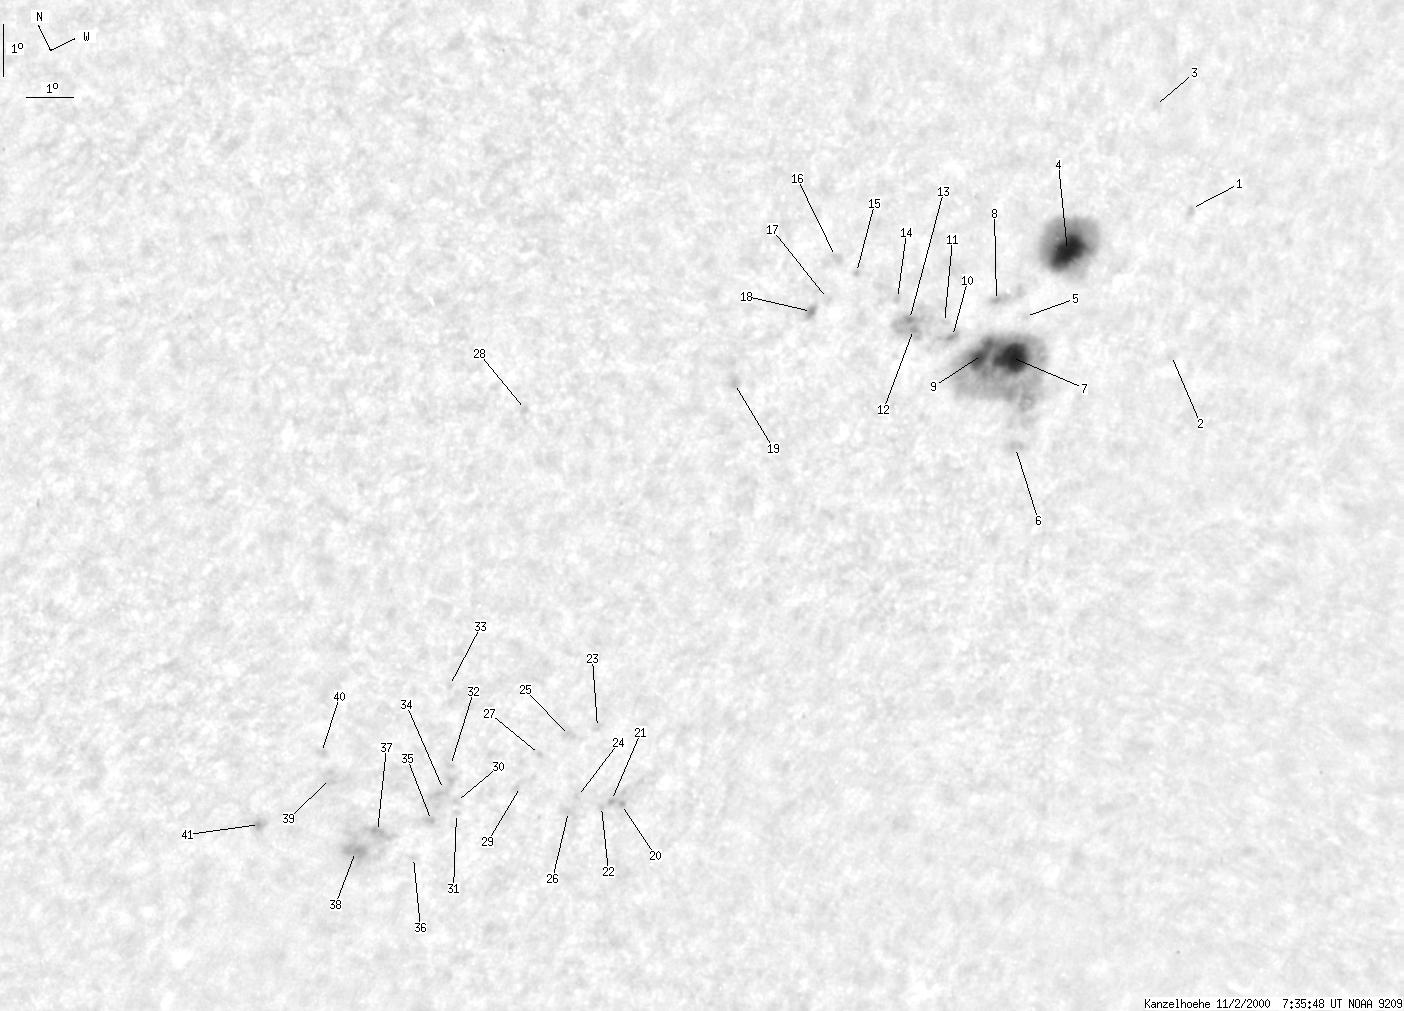
| group | Proj. U | Proj. WS | Corr. U | Corr. WS | B | L | LCM | Pos. angle | r |
| 66 | 529 | 39 | 317 | -23.84 | 302.75 | 18.93 | 212.06 | 0.5630 | |
|
previous
or next day for the same group /
back to the solar disc Kanzelhoehe 2000-11-02 07:35:48 UT |
| spot | Proj. U | Proj. WS | Corr. U | Corr. WS | B | L | LCM | Pos. angle | r |
| 0 | 1 | 0 | 1 | -22.71 | 310.18 | 26.36 | 222.58 | 0.6076 | |
| 0 | 4 | 0 | 2 | -25.24 | 308.98 | 25.16 | 218.40 | 0.6215 | |
| 0 | 0 | 0 | 0 | -20.53 | 309.97 | 26.15 | 225.08 | 0.5851 | |
| 22 | 123 | 13 | 75 | -22.35 | 307.30 | 23.48 | 219.85 | 0.5773 | |
| 0 | 3 | 0 | 2 | -23.17 | 306.05 | 22.23 | 217.40 | 0.5748 | |
| 0 | 9 | 0 | 6 | -25.50 | 305.12 | 21.29 | 213.72 | 0.5927 | |
| 22 | 207 | 13 | 125 | -23.80 | 305.53 | 21.71 | 216.06 | 0.5772 | |
| 1 | 16 | 1 | 9 | -22.62 | 305.54 | 21.72 | 217.42 | 0.5644 | |
| 10 | -7 | 6 | -7 | -23.48 | 304.94 | 21.12 | 215.69 | 0.5687 | |
| 0 | 7 | 0 | 4 | -22.88 | 304.43 | 20.61 | 215.71 | 0.5577 | |
| 0 | 1 | 0 | 1 | -22.55 | 304.34 | 20.52 | 215.98 | 0.5533 | |
| 1 | 35 | 1 | 21 | -22.40 | 303.67 | 19.85 | 215.27 | 0.5459 | |
| 2 | -12 | 1 | -12 | -22.18 | 303.65 | 19.83 | 215.49 | 0.5432 | |
| 0 | 2 | 0 | 1 | -21.70 | 303.54 | 19.72 | 215.91 | 0.5366 | |
| 0 | 1 | 0 | 0 | -20.87 | 302.88 | 19.06 | 215.99 | 0.5213 | |
| 0 | 2 | 0 | 1 | -20.40 | 302.56 | 18.74 | 216.12 | 0.5130 | |
| 0 | 3 | 0 | 2 | -21.08 | 302.15 | 18.33 | 214.70 | 0.5174 | |
| 2 | 7 | 1 | 4 | -21.17 | 301.75 | 17.93 | 214.02 | 0.5152 | |
| 0 | 3 | 0 | 1 | -21.80 | 299.80 | 15.98 | 210.39 | 0.5073 | |
| 0 | 6 | 0 | 4 | -28.67 | 294.86 | 11.04 | 197.24 | 0.5694 | |
| 0 | -20 | 0 | -20 | -28.50 | 294.69 | 10.87 | 197.08 | 0.5664 | |
| 0 | 2 | 0 | 1 | -28.53 | 294.45 | 10.63 | 196.72 | 0.5657 | |
| 0 | 1 | 0 | 0 | -26.97 | 294.90 | 11.08 | 198.35 | 0.5463 | |
| 0 | 2 | 0 | 1 | -28.11 | 294.04 | 10.22 | 196.34 | 0.5583 | |
| 0 | 2 | 0 | 1 | -26.87 | 294.30 | 10.48 | 197.48 | 0.5422 | |
| 0 | 2 | 0 | 1 | -28.32 | 293.76 | 9.94 | 195.81 | 0.5601 | |
| 0 | 1 | 0 | 0 | -26.96 | 293.58 | 9.76 | 196.30 | 0.5404 | |
| 0 | 1 | 0 | 1 | -20.46 | 295.66 | 11.84 | 204.82 | 0.4601 | |
| 0 | 6 | 0 | 4 | -27.40 | 292.99 | 9.17 | 195.13 | 0.5442 | |
| 0 | 2 | 0 | 1 | -27.11 | 291.64 | 7.82 | 193.14 | 0.5353 | |
| 0 | 1 | 0 | 1 | -27.34 | 291.56 | 7.74 | 192.89 | 0.5383 | |
| 0 | 1 | 0 | 1 | -26.37 | 291.79 | 7.97 | 193.73 | 0.5251 | |
| 0 | 1 | 0 | 1 | -24.85 | 292.34 | 8.52 | 195.48 | 0.5053 | |
| 0 | 8 | 0 | 5 | -26.76 | 291.48 | 7.66 | 193.04 | 0.5298 | |
| 0 | 2 | 0 | 1 | -27.25 | 291.03 | 7.21 | 192.07 | 0.5353 | |
| 0 | 2 | 0 | 1 | -27.80 | 290.41 | 6.59 | 190.85 | 0.5414 | |
| 2 | 52 | 1 | 30 | -26.97 | 289.91 | 6.09 | 190.36 | 0.5281 | |
| 4 | -37 | 2 | -37 | -27.16 | 289.35 | 5.53 | 189.35 | 0.5294 | |
| 0 | 6 | 0 | 4 | -25.55 | 289.42 | 5.60 | 190.07 | 0.5059 | |
| 0 | 2 | 0 | 1 | -24.98 | 289.45 | 5.63 | 190.34 | 0.4975 | |
| 0 | 5 | 0 | 3 | -25.79 | 287.75 | 3.93 | 187.04 | 0.5058 | |
| Proj. U | - Projected umbra area in millionths of solar disc, negative values indicate | |
|
that the umbra consists of fragmented regions which cannot be separated without losing umbral area. In this way several spots (intensity minima in the umbra) have a common umbra, e.g. -2 means that the given spot shares an umbra with spot No.2, and the common U value is indicated at spot No.2. |
||
| Proj. WS | - Projected whole spot area in millionths of solar disc, negative values indicate | |
|
that several umbras have a common penumbra, e.g. -7 means that the given umbra shares a penumbra with umbra No.7, and the WS value is indicated at No.7. |
||
| Corr. U | - Corrected umbra area in millionths of solar hemisphere, for negative values see above | |
| Corr. WS | - Corrected whole spot area in millionths of solar hemisphere, for negative values see above | |
| B | - Heliographic latitude B; positive: North, negative: South | |
| L | - Heliographic longitude L | |
| LCM | - Longitudinal distance from the Sun's central meridian | |
| Pos. angle | - Position angle | |
| r | - Distance from the centre of Sun's disc in terms of Sun's radius | |