Debrecen 2000-11-03 13:38:01 UT
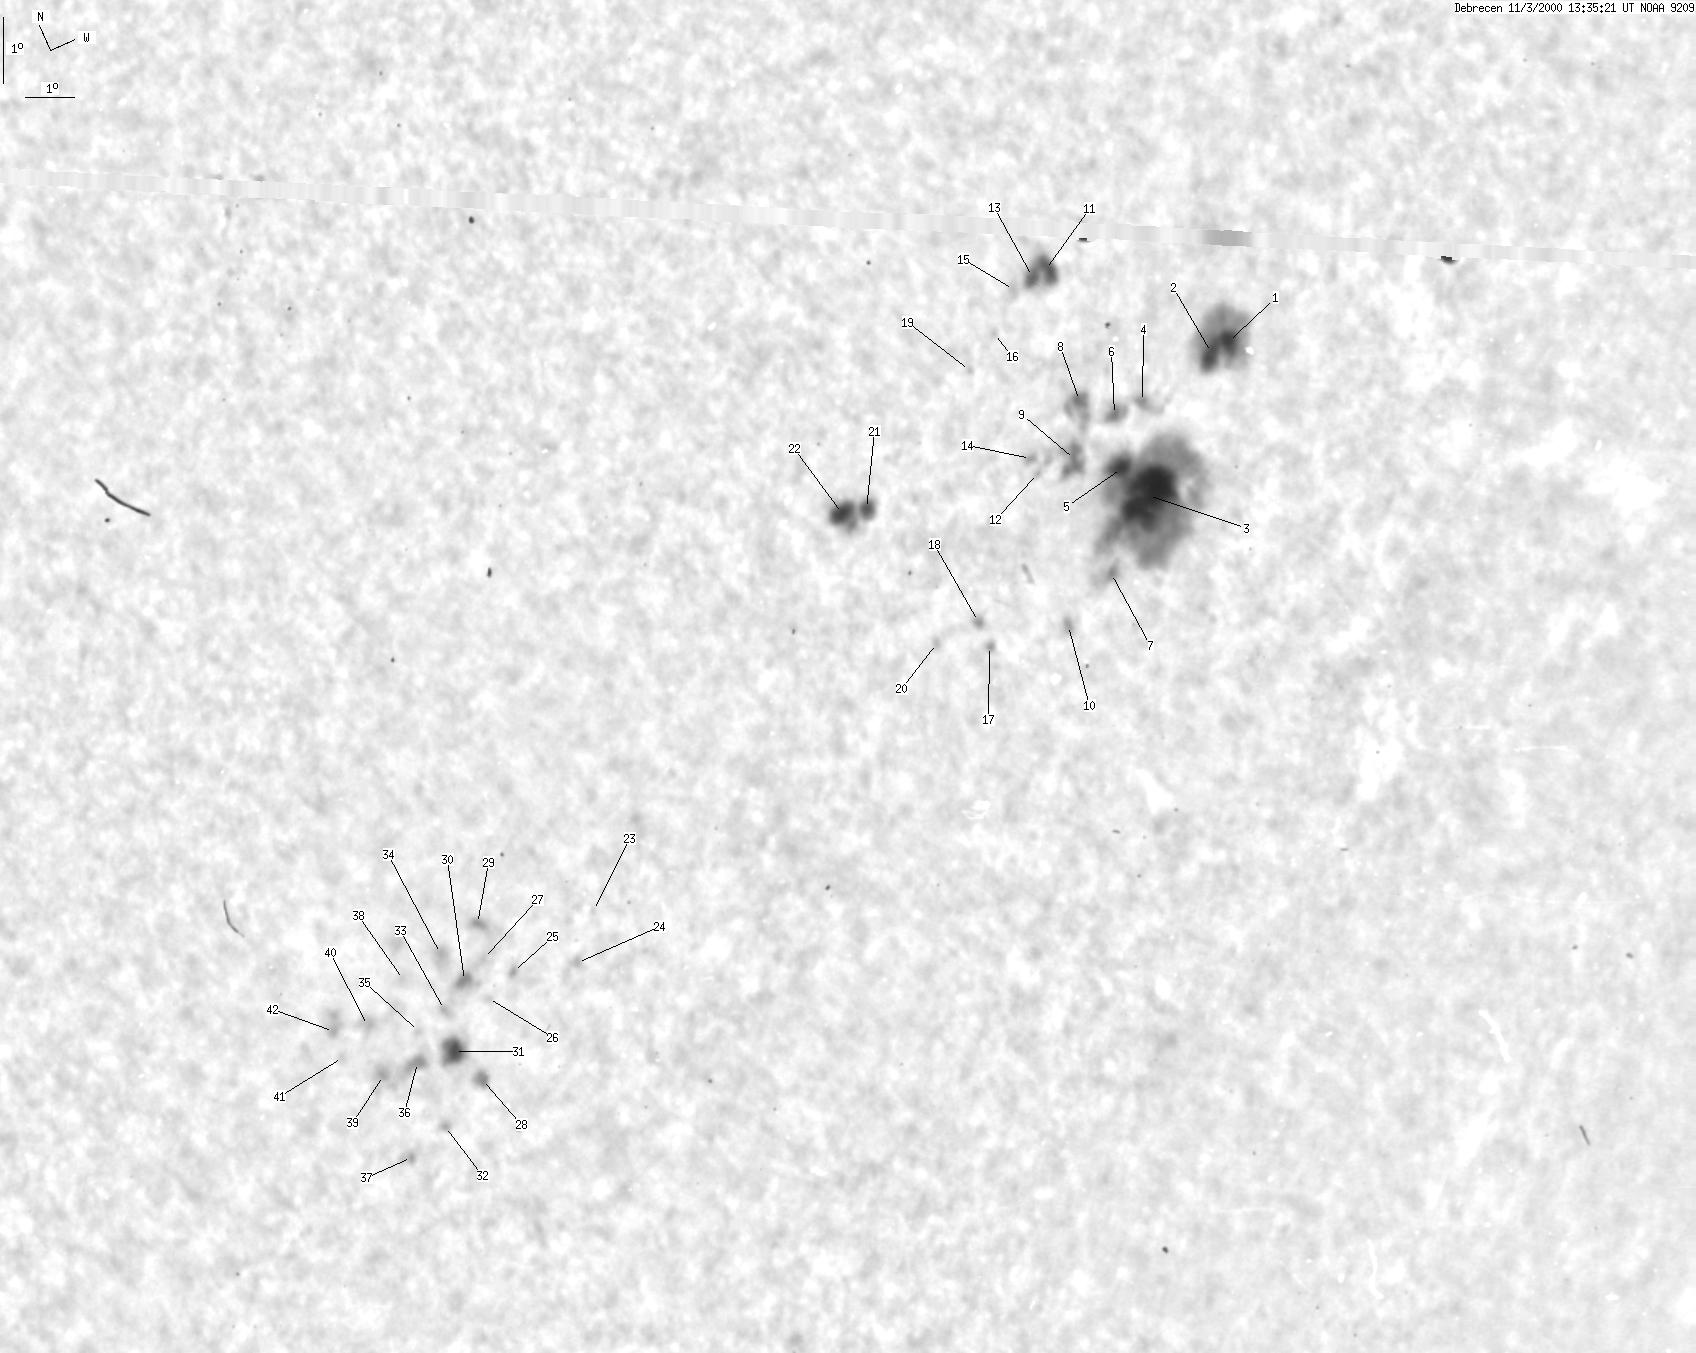
| group | Proj. U | Proj. WS | Corr. U | Corr. WS | B | L | LCM | Pos. angle | r |
| 81 | 586 | 56 | 411 | -24.13 | 303.11 | 35.78 | 228.79 | 0.7098 | |
|
previous
or next day for the same group /
back to the solar disc Debrecen 2000-11-03 13:38:01 UT |
| spot | Proj. U | Proj. WS | Corr. U | Corr. WS | B | L | LCM | Pos. angle | r |
| 6 | 66 | 5 | 49 | -22.44 | 307.94 | 40.61 | 234.41 | 0.7422 | |
| 6 | -1 | 4 | -1 | -22.51 | 307.52 | 40.19 | 234.06 | 0.7386 | |
| 32 | 285 | 23 | 207 | -24.19 | 305.94 | 38.61 | 231.09 | 0.7339 | |
| 1 | 23 | 0 | 16 | -22.74 | 305.98 | 38.65 | 232.82 | 0.7253 | |
| 3 | -3 | 2 | -3 | -23.58 | 305.37 | 38.04 | 231.43 | 0.7247 | |
| 2 | -4 | 1 | -4 | -22.71 | 305.38 | 38.05 | 232.47 | 0.7193 | |
| 1 | -3 | 1 | -3 | -25.12 | 304.99 | 37.65 | 229.38 | 0.7311 | |
| 2 | 15 | 1 | 11 | -22.30 | 304.69 | 37.36 | 232.50 | 0.7100 | |
| 2 | 22 | 2 | 16 | -23.20 | 304.45 | 37.12 | 231.25 | 0.7135 | |
| 0 | 3 | 0 | 2 | -25.66 | 303.93 | 36.59 | 228.02 | 0.7252 | |
| 10 | 25 | 7 | 17 | -20.20 | 304.39 | 37.06 | 234.89 | 0.6938 | |
| 0 | 1 | 0 | 1 | -23.09 | 303.65 | 36.32 | 230.84 | 0.7051 | |
| -11 | -11 | -11 | -11 | -20.20 | 304.06 | 36.73 | 234.66 | 0.6904 | |
| 0 | 2 | 0 | 1 | -22.83 | 303.55 | 36.22 | 231.06 | 0.7024 | |
| 0 | 2 | 0 | 1 | -20.21 | 303.73 | 36.38 | 234.42 | 0.6868 | |
| 0 | 1 | 0 | 0 | -20.73 | 303.22 | 35.87 | 233.41 | 0.6850 | |
| 0 | 3 | 0 | 2 | -25.45 | 302.29 | 34.96 | 227.08 | 0.7090 | |
| 0 | 3 | 0 | 2 | -24.99 | 302.08 | 34.75 | 227.44 | 0.7037 | |
| 0 | 1 | 0 | 0 | -21.10 | 302.62 | 35.27 | 232.50 | 0.6814 | |
| 0 | 1 | 0 | 1 | -25.02 | 301.17 | 33.83 | 226.70 | 0.6956 | |
| 1 | 29 | 1 | 19 | -22.50 | 300.13 | 32.80 | 228.87 | 0.6667 | |
| 5 | -21 | 3 | -21 | -22.38 | 299.68 | 32.35 | 228.65 | 0.6614 | |
| 0 | 1 | 0 | 1 | -26.75 | 293.89 | 26.55 | 218.28 | 0.6467 | |
| 1 | 7 | 0 | 4 | -27.42 | 293.47 | 26.14 | 217.16 | 0.6498 | |
| 0 | 2 | 0 | 1 | -27.18 | 292.29 | 24.95 | 216.18 | 0.6379 | |
| 0 | 2 | 0 | 1 | -27.43 | 291.75 | 24.41 | 215.35 | 0.6363 | |
| 0 | 1 | 0 | 1 | -26.77 | 291.73 | 24.39 | 216.02 | 0.6294 | |
| 1 | 8 | 1 | 5 | -28.68 | 291.37 | 24.04 | 213.71 | 0.6463 | |
| 0 | 4 | 0 | 3 | -26.14 | 291.71 | 24.37 | 216.67 | 0.6227 | |
| 1 | 9 | 1 | 6 | -27.01 | 291.31 | 23.98 | 215.32 | 0.6285 | |
| 4 | 13 | 3 | 8 | -28.04 | 290.95 | 23.62 | 213.89 | 0.6365 | |
| 0 | 2 | 0 | 1 | -29.17 | 290.56 | 23.23 | 212.37 | 0.6455 | |
| 0 | 1 | 0 | 1 | -27.31 | 290.92 | 23.57 | 214.58 | 0.6285 | |
| 0 | 4 | 0 | 3 | -26.42 | 291.00 | 23.67 | 215.60 | 0.6199 | |
| 0 | 1 | 0 | 0 | -27.48 | 290.38 | 23.04 | 213.81 | 0.6262 | |
| 2 | 29 | 1 | 18 | -27.96 | 290.16 | 22.83 | 213.10 | 0.6297 | |
| 0 | 2 | 0 | 2 | -29.38 | 289.75 | 22.42 | 211.30 | 0.6422 | |
| 0 | 3 | 0 | 2 | -26.56 | 290.27 | 22.93 | 214.62 | 0.6155 | |
| 1 | -36 | 0 | -36 | -27.91 | 289.57 | 22.24 | 212.50 | 0.6248 | |
| 0 | 8 | 0 | 5 | -27.09 | 289.47 | 22.13 | 213.19 | 0.6151 | |
| 0 | 1 | 0 | 0 | -27.38 | 288.94 | 21.59 | 212.27 | 0.6143 | |
| 0 | 6 | 0 | 4 | -26.92 | 288.82 | 21.49 | 212.61 | 0.6084 | |
| Proj. U | - Projected umbra area in millionths of solar disc, negative values indicate | |
|
that the umbra consists of fragmented regions which cannot be separated without losing umbral area. In this way several spots (intensity minima in the umbra) have a common umbra, e.g. -2 means that the given spot shares an umbra with spot No.2, and the common U value is indicated at spot No.2. |
||
| Proj. WS | - Projected whole spot area in millionths of solar disc, negative values indicate | |
|
that several umbras have a common penumbra, e.g. -7 means that the given umbra shares a penumbra with umbra No.7, and the WS value is indicated at No.7. |
||
| Corr. U | - Corrected umbra area in millionths of solar hemisphere, for negative values see above | |
| Corr. WS | - Corrected whole spot area in millionths of solar hemisphere, for negative values see above | |
| B | - Heliographic latitude B; positive: North, negative: South | |
| L | - Heliographic longitude L | |
| LCM | - Longitudinal distance from the Sun's central meridian | |
| Pos. angle | - Position angle | |
| r | - Distance from the centre of Sun's disc in terms of Sun's radius | |