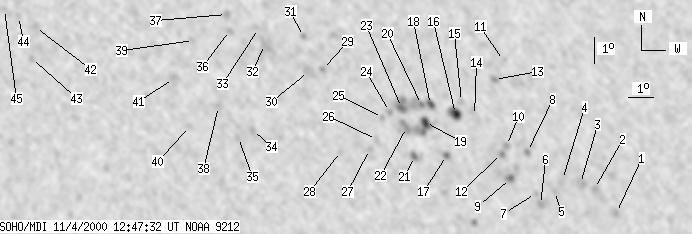
SOHO MDI 2000-11-04 12:47:32 UT
| group | Proj. U | Proj. WS | Corr. U | Corr. WS | B | L | LCM | Pos. angle | r |
| 27 | 476 | 13 | 241 | 9.63 | 269.04 | 14.44 | 292.38 | 0.2664 | |
|
previous
or next day for the same group /
back to the solar disc SOHO MDI 2000-11-04 12:47:32 UT |
| spot | Proj. U | Proj. WS | Corr. U | Corr. WS | B | L | LCM | Pos. angle | r |
| 0 | 6 | 0 | 3 | 6.05 | 277.17 | 22.57 | 276.33 | 0.3858 | |
| 0 | 6 | 0 | 3 | 7.00 | 276.30 | 21.70 | 279.05 | 0.3732 | |
| 0 | 23 | 0 | 12 | 7.21 | 275.72 | 21.12 | 279.81 | 0.3645 | |
| 0 | 8 | 0 | 4 | 7.38 | 274.98 | 20.39 | 280.58 | 0.3530 | |
| 0 | 7 | 0 | 4 | 6.93 | 274.63 | 20.03 | 279.43 | 0.3463 | |
| 0 | 8 | 0 | 4 | 6.44 | 274.04 | 19.44 | 278.21 | 0.3356 | |
| 0 | 4 | 0 | 2 | 6.87 | 273.85 | 19.25 | 279.56 | 0.3334 | |
| 0 | 6 | 0 | 3 | 8.49 | 273.60 | 19.00 | 284.51 | 0.3340 | |
| 7 | 79 | 3 | 41 | 7.47 | 272.85 | 18.25 | 281.85 | 0.3187 | |
| 0 | 7 | 0 | 3 | 8.74 | 272.75 | 18.15 | 285.84 | 0.3214 | |
| 0 | 5 | 0 | 3 | 12.03 | 272.82 | 18.22 | 295.27 | 0.3397 | |
| 0 | 6 | 0 | 3 | 8.44 | 272.53 | 17.93 | 285.07 | 0.3167 | |
| 0 | 7 | 0 | 4 | 11.30 | 272.40 | 17.80 | 293.71 | 0.3289 | |
| 0 | 17 | 0 | 9 | 9.93 | 271.50 | 16.90 | 290.57 | 0.3072 | |
| 0 | 6 | 0 | 3 | 10.48 | 271.00 | 16.40 | 292.83 | 0.3026 | |
| 9 | 22 | 4 | 11 | 10.02 | 270.73 | 16.13 | 291.69 | 0.2958 | |
| 0 | 6 | 0 | 3 | 8.40 | 270.29 | 15.69 | 286.77 | 0.2807 | |
| 3 | 9 | 2 | 4 | 10.39 | 269.73 | 15.13 | 294.10 | 0.2826 | |
| 8 | 30 | 4 | 15 | 9.69 | 269.50 | 14.90 | 292.07 | 0.2747 | |
| 0 | 21 | 0 | 11 | 10.39 | 269.37 | 14.77 | 294.61 | 0.2771 | |
| 0 | 11 | 0 | 6 | 8.39 | 269.00 | 14.40 | 288.00 | 0.2599 | |
| 0 | 12 | 0 | 6 | 9.51 | 268.72 | 14.13 | 292.44 | 0.2616 | |
| 0 | 25 | 0 | 13 | 10.29 | 268.56 | 13.96 | 295.43 | 0.2640 | |
| 0 | 6 | 0 | 3 | 10.14 | 268.07 | 13.47 | 295.66 | 0.2555 | |
| 0 | 4 | 0 | 2 | 9.91 | 267.78 | 13.18 | 295.29 | 0.2495 | |
| 0 | 5 | 0 | 3 | 9.07 | 267.50 | 12.90 | 292.50 | 0.2398 | |
| 0 | 5 | 0 | 2 | 8.69 | 267.21 | 12.61 | 291.41 | 0.2329 | |
| 0 | 5 | 0 | 2 | 8.63 | 266.06 | 11.46 | 292.98 | 0.2143 | |
| 0 | 6 | 0 | 3 | 11.81 | 265.45 | 10.85 | 306.89 | 0.2315 | |
| 0 | 14 | 0 | 7 | 11.74 | 264.89 | 10.29 | 308.07 | 0.2232 | |
| 0 | 6 | 0 | 3 | 13.10 | 264.74 | 10.14 | 313.09 | 0.2360 | |
| 0 | 18 | 0 | 9 | 12.81 | 263.17 | 8.57 | 316.86 | 0.2136 | |
| 0 | 8 | 0 | 4 | 13.43 | 262.95 | 8.35 | 319.56 | 0.2189 | |
| 0 | 7 | 0 | 3 | 9.48 | 262.60 | 8.00 | 305.35 | 0.1691 | |
| 0 | 7 | 0 | 4 | 9.21 | 262.04 | 7.44 | 305.93 | 0.1587 | |
| 0 | 6 | 0 | 3 | 13.36 | 261.80 | 7.20 | 323.47 | 0.2057 | |
| 0 | 7 | 0 | 3 | 13.99 | 261.69 | 7.09 | 325.63 | 0.2133 | |
| 0 | 4 | 0 | 2 | 10.42 | 261.28 | 6.68 | 314.75 | 0.1620 | |
| 0 | 10 | 0 | 5 | 12.98 | 260.35 | 5.75 | 328.24 | 0.1865 | |
| 0 | 3 | 0 | 1 | 9.65 | 260.13 | 5.53 | 316.48 | 0.1386 | |
| 0 | 6 | 0 | 3 | 11.51 | 259.53 | 4.93 | 327.50 | 0.1576 | |
| 0 | 6 | 0 | 3 | 13.51 | 254.11 | -0.49 | 2.87 | 0.1675 | |
| 0 | 6 | 0 | 3 | 12.30 | 253.95 | -0.65 | 4.33 | 0.1468 | |
| 0 | 4 | 0 | 2 | 13.94 | 253.43 | -1.17 | 6.48 | 0.1758 | |
| 0 | 2 | 0 | 1 | 14.21 | 252.88 | -1.72 | 9.27 | 0.1818 | |
| Proj. U | - Projected umbra area in millionths of solar disc, negative values indicate | |
|
that the umbra consists of fragmented regions which cannot be separated without losing umbral area. In this way several spots (intensity minima in the umbra) have a common umbra, e.g. -2 means that the given spot shares an umbra with spot No.2, and the common U value is indicated at spot No.2. |
||
| Proj. WS | - Projected whole spot area in millionths of solar disc, negative values indicate | |
|
that several umbras have a common penumbra, e.g. -7 means that the given umbra shares a penumbra with umbra No.7, and the WS value is indicated at No.7. |
||
| Corr. U | - Corrected umbra area in millionths of solar hemisphere, for negative values see above | |
| Corr. WS | - Corrected whole spot area in millionths of solar hemisphere, for negative values see above | |
| B | - Heliographic latitude B; positive: North, negative: South | |
| L | - Heliographic longitude L | |
| LCM | - Longitudinal distance from the Sun's central meridian | |
| Pos. angle | - Position angle | |
| r | - Distance from the centre of Sun's disc in terms of Sun's radius | |