Gyula 2000-12-14 10:32:15 UT
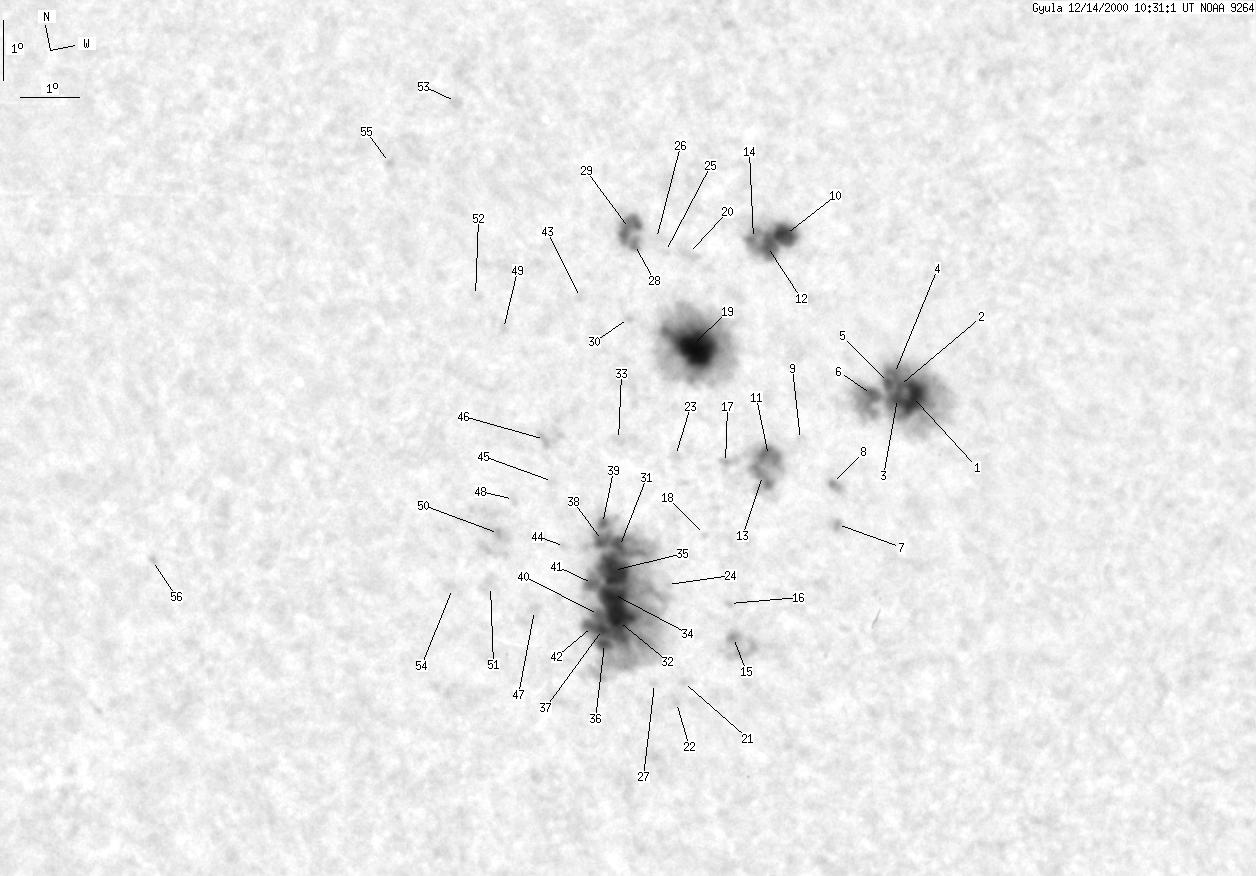
| group | Proj. U | Proj. WS | Corr. U | Corr. WS | B | L | LCM | Pos. angle | r |
| 138 | 717 | 82 | 421 | -24.10 | 65.03 | -23.59 | 137.34 | 0.5404 | |
|
previous
or next day for the same group /
back to the solar disc Gyula 2000-12-14 10:32:15 UT |
| spot | Proj. U | Proj. WS | Corr. U | Corr. WS | B | L | LCM | Pos. angle | r |
| 8 | 116 | 4 | 66 | -23.77 | 69.30 | -19.32 | 142.16 | 0.4956 | |
| 1 | -1 | 1 | -1 | -23.49 | 69.12 | -19.51 | 141.52 | 0.4942 | |
| 2 | -1 | 1 | -1 | -23.73 | 69.04 | -19.59 | 141.74 | 0.4977 | |
| 3 | -1 | 1 | -1 | -23.28 | 69.10 | -19.53 | 141.21 | 0.4921 | |
| 1 | -1 | 1 | -1 | -23.45 | 68.98 | -19.65 | 141.28 | 0.4951 | |
| 3 | -1 | 2 | -1 | -23.61 | 68.67 | -19.95 | 141.09 | 0.4997 | |
| 0 | 1 | 0 | 1 | -25.61 | 67.32 | -21.30 | 141.99 | 0.5342 | |
| 0 | 2 | 0 | 1 | -24.98 | 67.50 | -21.12 | 141.41 | 0.5257 | |
| 0 | 1 | 0 | 1 | -24.07 | 67.15 | -21.48 | 139.74 | 0.5194 | |
| 13 | 41 | 7 | 23 | -20.77 | 68.05 | -20.57 | 136.08 | 0.4756 | |
| 4 | 47 | 2 | 28 | -24.28 | 66.46 | -22.16 | 139.18 | 0.5282 | |
| -10 | -10 | -10 | -10 | -20.91 | 67.73 | -20.89 | 135.88 | 0.4804 | |
| 4 | -11 | 3 | -11 | -24.54 | 66.29 | -22.34 | 139.33 | 0.5326 | |
| 3 | -10 | 1 | -10 | -20.74 | 67.49 | -21.14 | 135.29 | 0.4815 | |
| 1 | 26 | 1 | 16 | -27.13 | 64.77 | -23.85 | 140.95 | 0.5733 | |
| 0 | 1 | 0 | 0 | -26.56 | 64.88 | -23.74 | 140.36 | 0.5666 | |
| 0 | -11 | 0 | -11 | -24.22 | 65.75 | -22.88 | 138.25 | 0.5347 | |
| 0 | 0 | 0 | 0 | -25.32 | 64.93 | -23.70 | 138.79 | 0.5538 | |
| 34 | 130 | 19 | 75 | -22.34 | 65.89 | -22.73 | 135.77 | 0.5143 | |
| 0 | 8 | 0 | 5 | -20.79 | 66.33 | -22.30 | 133.93 | 0.4946 | |
| 0 | 1 | 0 | 0 | -27.72 | 63.52 | -25.10 | 140.34 | 0.5905 | |
| 0 | 1 | 0 | 0 | -28.00 | 63.26 | -25.37 | 140.39 | 0.5956 | |
| 0 | 1 | 0 | 1 | -23.96 | 64.93 | -23.70 | 136.96 | 0.5403 | |
| 0 | 0 | 0 | 0 | -26.06 | 63.94 | -24.68 | 138.69 | 0.5704 | |
| 0 | 1 | 0 | 1 | -20.70 | 65.96 | -22.67 | 133.33 | 0.4978 | |
| 0 | 4 | 0 | 2 | -20.47 | 65.88 | -22.75 | 132.87 | 0.4965 | |
| 0 | 2 | 0 | 1 | -27.62 | 63.02 | -25.62 | 139.67 | 0.5942 | |
| 1 | 25 | 1 | 14 | -20.50 | 65.50 | -23.13 | 132.48 | 0.5010 | |
| 7 | -28 | 4 | -28 | -20.24 | 65.44 | -23.18 | 132.02 | 0.4991 | |
| 0 | 1 | 0 | 0 | -21.65 | 64.96 | -23.67 | 133.63 | 0.5177 | |
| 4 | 219 | 2 | 133 | -25.26 | 63.38 | -25.24 | 137.04 | 0.5681 | |
| 14 | -31 | 9 | -31 | -26.46 | 62.83 | -25.79 | 138.03 | 0.5847 | |
| 0 | 3 | 0 | 2 | -23.54 | 64.06 | -24.58 | 135.40 | 0.5451 | |
| 8 | -31 | 5 | -31 | -26.12 | 62.95 | -25.68 | 137.71 | 0.5805 | |
| 13 | -31 | 8 | -31 | -25.67 | 63.12 | -25.50 | 137.31 | 0.5746 | |
| 2 | -31 | 1 | -31 | -26.87 | 62.45 | -26.17 | 138.17 | 0.5922 | |
| 1 | -31 | 1 | -31 | -26.59 | 62.55 | -26.08 | 137.91 | 0.5887 | |
| 3 | -31 | 2 | -31 | -25.12 | 63.12 | -25.51 | 136.57 | 0.5695 | |
| 1 | -31 | 1 | -31 | -24.85 | 63.23 | -25.40 | 136.32 | 0.5658 | |
| 2 | -31 | 1 | -31 | -26.31 | 62.53 | -26.10 | 137.53 | 0.5864 | |
| 2 | -31 | 1 | -31 | -25.79 | 62.64 | -25.99 | 136.97 | 0.5804 | |
| 1 | -31 | 1 | -31 | -26.49 | 62.33 | -26.30 | 137.57 | 0.5899 | |
| 0 | 2 | 0 | 1 | -21.18 | 64.27 | -24.36 | 132.15 | 0.5209 | |
| 0 | 3 | 0 | 2 | -25.08 | 62.46 | -26.16 | 135.86 | 0.5755 | |
| 0 | 3 | 0 | 2 | -24.02 | 62.64 | -25.99 | 134.58 | 0.5642 | |
| 1 | 26 | 1 | 16 | -23.39 | 62.81 | -25.81 | 133.88 | 0.5565 | |
| 0 | 3 | 0 | 2 | -26.06 | 61.42 | -27.21 | 136.11 | 0.5947 | |
| 0 | 2 | 0 | 1 | -24.20 | 61.84 | -26.79 | 134.03 | 0.5740 | |
| 0 | 1 | 0 | 1 | -21.45 | 62.77 | -25.86 | 130.99 | 0.5399 | |
| 1 | 28 | 1 | 17 | -24.71 | 61.31 | -27.31 | 134.22 | 0.5839 | |
| 0 | 8 | 0 | 5 | -25.54 | 60.82 | -27.81 | 134.85 | 0.5961 | |
| 0 | 2 | 0 | 1 | -20.85 | 62.50 | -26.14 | 129.80 | 0.5380 | |
| 0 | 1 | 0 | 0 | -17.77 | 63.26 | -25.37 | 125.59 | 0.5038 | |
| 0 | 5 | 0 | 3 | -25.46 | 60.12 | -28.51 | 134.10 | 0.6024 | |
| 0 | 1 | 0 | 0 | -18.55 | 61.81 | -26.82 | 125.49 | 0.5275 | |
| 0 | 1 | 0 | 0 | -24.09 | 54.89 | -33.73 | 128.03 | 0.6459 | |
| Proj. U | - Projected umbra area in millionths of solar disc, negative values indicate | |
|
that the umbra consists of fragmented regions which cannot be separated without losing umbral area. In this way several spots (intensity minima in the umbra) have a common umbra, e.g. -2 means that the given spot shares an umbra with spot No.2, and the common U value is indicated at spot No.2. |
||
| Proj. WS | - Projected whole spot area in millionths of solar disc, negative values indicate | |
|
that several umbras have a common penumbra, e.g. -7 means that the given umbra shares a penumbra with umbra No.7, and the WS value is indicated at No.7. |
||
| Corr. U | - Corrected umbra area in millionths of solar hemisphere, for negative values see above | |
| Corr. WS | - Corrected whole spot area in millionths of solar hemisphere, for negative values see above | |
| B | - Heliographic latitude B; positive: North, negative: South | |
| L | - Heliographic longitude L | |
| LCM | - Longitudinal distance from the Sun's central meridian | |
| Pos. angle | - Position angle | |
| r | - Distance from the centre of Sun's disc in terms of Sun's radius | |