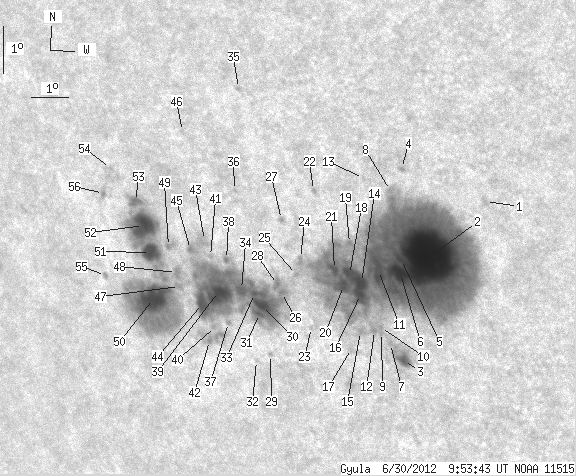
Gyula 2012-06-30 09:55:43 UT
| group | Proj. U | Proj. WS | Corr. U | Corr. WS | B | L | LCM | Pos. angle | r |
| 236 | 1032 | 156 | 694 | -16.32 | 205.34 | -38.23 | 118.26 | 0.6752 | |
|
previous
or next day for the same group /
back to the solar disc Gyula 2012-06-30 09:55:43 UT |
| spot | Proj. U | Proj. WS | Corr. U | Corr. WS | B | L | LCM | Pos. angle | r |
| 0 | 1 | 0 | 1 | -14.46 | 210.14 | -33.42 | 118.48 | 0.6090 | |
| 128 | 617 | 82 | 400 | -15.81 | 208.39 | -35.18 | 119.29 | 0.6378 | |
| 3 | 12 | 2 | 8 | -18.02 | 207.54 | -36.03 | 121.82 | 0.6605 | |
| 0 | 1 | 0 | 1 | -13.91 | 208.06 | -35.50 | 116.34 | 0.6313 | |
| -2 | -2 | -2 | -2 | -15.89 | 207.78 | -35.79 | 119.02 | 0.6455 | |
| -2 | -2 | -2 | -2 | -16.15 | 207.71 | -35.85 | 119.35 | 0.6477 | |
| 0 | 1 | 0 | 1 | -17.68 | 207.23 | -36.34 | 121.15 | 0.6620 | |
| 0 | 2 | 0 | 1 | -14.39 | 207.72 | -35.85 | 116.85 | 0.6380 | |
| 0 | 1 | 0 | 0 | -17.46 | 207.03 | -36.54 | 120.72 | 0.6630 | |
| 0 | 1 | 0 | 0 | -17.35 | 207.02 | -36.55 | 120.57 | 0.6625 | |
| 6 | -2 | 4 | -2 | -16.13 | 207.16 | -36.40 | 118.97 | 0.6539 | |
| 0 | 2 | 0 | 1 | -17.43 | 206.85 | -36.72 | 120.57 | 0.6648 | |
| 0 | 0 | 0 | 0 | -14.19 | 207.04 | -36.52 | 116.16 | 0.6451 | |
| 15 | -2 | 10 | -2 | -16.42 | 206.67 | -36.90 | 119.07 | 0.6612 | |
| 0 | 2 | 0 | 1 | -17.48 | 206.46 | -37.10 | 120.40 | 0.6694 | |
| -14 | -2 | -14 | -2 | -16.68 | 206.60 | -36.97 | 119.39 | 0.6634 | |
| 0 | 2 | 0 | 1 | -17.86 | 206.15 | -37.42 | 120.73 | 0.6750 | |
| -14 | -2 | -14 | -2 | -16.27 | 206.37 | -37.19 | 118.69 | 0.6638 | |
| 0 | -2 | 0 | -2 | -15.60 | 206.48 | -37.09 | 117.83 | 0.6591 | |
| 4 | -2 | 3 | -2 | -16.51 | 206.17 | -37.39 | 118.91 | 0.6674 | |
| 2 | -2 | 1 | -2 | -16.19 | 205.99 | -37.58 | 118.35 | 0.6678 | |
| 0 | 1 | 0 | 1 | -14.54 | 205.67 | -37.89 | 115.89 | 0.6631 | |
| 0 | 0 | 0 | 0 | -17.48 | 205.13 | -38.43 | 119.62 | 0.6843 | |
| 0 | 2 | 0 | 1 | -16.02 | 205.10 | -38.47 | 117.62 | 0.6771 | |
| 0 | 1 | 0 | 1 | -16.37 | 204.93 | -38.64 | 118.00 | 0.6808 | |
| 0 | 1 | 0 | 1 | -16.79 | 204.44 | -39.12 | 118.29 | 0.6884 | |
| 0 | 1 | 0 | 1 | -15.22 | 204.71 | -38.86 | 116.31 | 0.6776 | |
| 0 | 3 | 0 | 2 | -16.62 | 204.36 | -39.20 | 118.03 | 0.6884 | |
| 0 | 1 | 0 | 1 | -18.15 | 203.87 | -39.70 | 119.78 | 0.7016 | |
| 5 | 149 | 4 | 104 | -17.10 | 203.86 | -39.71 | 118.40 | 0.6964 | |
| 1 | -30 | 1 | -30 | -17.28 | 203.74 | -39.83 | 118.57 | 0.6986 | |
| 0 | 0 | 0 | 0 | -18.31 | 203.44 | -40.12 | 119.75 | 0.7070 | |
| 1 | -30 | 1 | -30 | -16.86 | 203.68 | -39.88 | 117.98 | 0.6972 | |
| 4 | -30 | 2 | -30 | -16.80 | 203.33 | -40.23 | 117.72 | 0.7008 | |
| 0 | 1 | 0 | 1 | -12.52 | 203.92 | -39.65 | 112.17 | 0.6749 | |
| 0 | 1 | 0 | 0 | -14.69 | 203.51 | -40.06 | 114.97 | 0.6890 | |
| 1 | 1 | 0 | 1 | -17.54 | 202.82 | -40.75 | 118.42 | 0.7099 | |
| 0 | 1 | 0 | 1 | -16.21 | 203.03 | -40.54 | 116.77 | 0.7014 | |
| 17 | -30 | 12 | -30 | -16.89 | 202.67 | -40.90 | 117.49 | 0.7085 | |
| 0 | 3 | 0 | 2 | -17.66 | 202.43 | -41.14 | 118.36 | 0.7147 | |
| 0 | 1 | 0 | 1 | -16.15 | 202.59 | -40.98 | 116.48 | 0.7060 | |
| 1 | 11 | 1 | 7 | -17.97 | 202.18 | -41.38 | 118.65 | 0.7188 | |
| 0 | 7 | 0 | 5 | -15.82 | 202.48 | -41.09 | 115.98 | 0.7057 | |
| 4 | -30 | 3 | -30 | -17.18 | 202.16 | -41.41 | 117.61 | 0.7154 | |
| 0 | 5 | 0 | 4 | -16.04 | 202.04 | -41.52 | 116.06 | 0.7115 | |
| 0 | 1 | 0 | 1 | -13.54 | 202.24 | -41.33 | 112.81 | 0.6987 | |
| 0 | 2 | 0 | 2 | -16.86 | 201.56 | -42.00 | 116.90 | 0.7204 | |
| 0 | 2 | 0 | 2 | -16.57 | 201.54 | -42.03 | 116.51 | 0.7193 | |
| 0 | 2 | 0 | 1 | -16.02 | 201.42 | -42.15 | 115.74 | 0.7183 | |
| 22 | 189 | 16 | 136 | -17.20 | 200.71 | -42.86 | 116.93 | 0.7310 | |
| 7 | -50 | 5 | -50 | -16.19 | 200.87 | -42.70 | 115.70 | 0.7250 | |
| 12 | -50 | 8 | -50 | -15.62 | 200.78 | -42.79 | 114.92 | 0.7237 | |
| 2 | -50 | 1 | -50 | -15.13 | 200.64 | -42.93 | 114.21 | 0.7231 | |
| 0 | 0 | 0 | 0 | -14.48 | 200.03 | -43.53 | 113.09 | 0.7273 | |
| 1 | 3 | 0 | 2 | -16.76 | 199.42 | -44.14 | 115.77 | 0.7428 | |
| 0 | 1 | 0 | 1 | -15.02 | 199.73 | -43.84 | 113.68 | 0.7327 | |
| Proj. U | - Projected umbra area in millionths of solar disc, negative values indicate | |
|
that the umbra consists of fragmented regions which cannot be separated without losing umbral area. In this way several spots (intensity minima in the umbra) have a common umbra, e.g. -2 means that the given spot shares an umbra with spot No.2, and the common U value is indicated at spot No.2. |
||
| Proj. WS | - Projected whole spot area in millionths of solar disc, negative values indicate | |
|
that several umbras have a common penumbra, e.g. -7 means that the given umbra shares a penumbra with umbra No.7, and the WS value is indicated at No.7. |
||
| Corr. U | - Corrected umbra area in millionths of solar hemisphere, for negative values see above | |
| Corr. WS | - Corrected whole spot area in millionths of solar hemisphere, for negative values see above | |
| B | - Heliographic latitude B; positive: North, negative: South | |
| L | - Heliographic longitude L | |
| LCM | - Longitudinal distance from the Sun's central meridian | |
| Pos. angle | - Position angle | |
| r | - Distance from the centre of Sun's disc in terms of Sun's radius | |