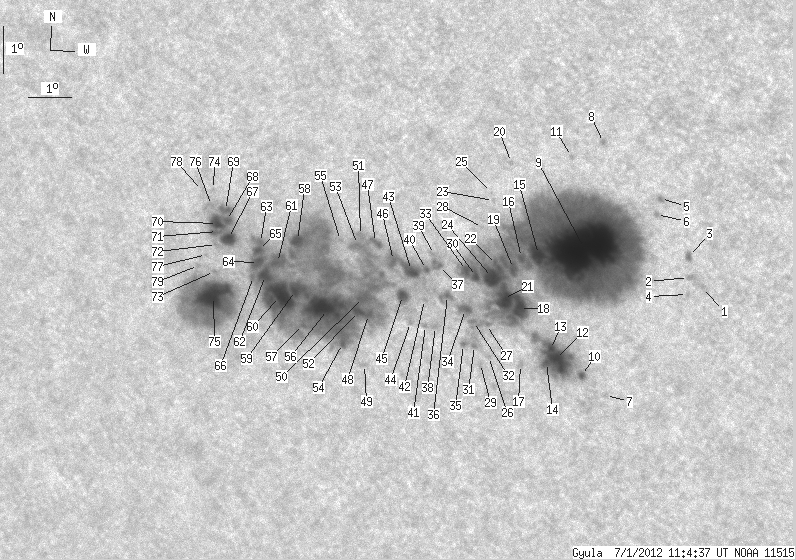
Gyula 2012-07-01 11:04:37 UT
| group | Proj. U | Proj. WS | Corr. U | Corr. WS | B | L | LCM | Pos. angle | r |
| 264 | 1352 | 155 | 781 | -16.43 | 205.33 | -24.35 | 129.90 | 0.5155 | |
|
previous
or next day for the same group /
back to the solar disc Gyula 2012-07-01 11:04:37 UT |
| spot | Proj. U | Proj. WS | Corr. U | Corr. WS | B | L | LCM | Pos. angle | r |
| 0 | 1 | 0 | 1 | -16.27 | 211.50 | -18.18 | 137.50 | 0.4451 | |
| 0 | 1 | 0 | 1 | -16.08 | 211.20 | -18.48 | 136.73 | 0.4461 | |
| 0 | 2 | 0 | 1 | -15.65 | 211.22 | -18.45 | 136.07 | 0.4412 | |
| 0 | 1 | 0 | 0 | -16.44 | 211.16 | -18.52 | 137.24 | 0.4506 | |
| 0 | 1 | 0 | 1 | -14.42 | 210.66 | -19.02 | 133.16 | 0.4344 | |
| 0 | 1 | 0 | 1 | -14.77 | 210.56 | -19.12 | 133.60 | 0.4392 | |
| 0 | 1 | 0 | 0 | -18.74 | 209.14 | -20.54 | 137.80 | 0.4966 | |
| 0 | 1 | 0 | 1 | -13.31 | 209.45 | -20.23 | 129.45 | 0.4376 | |
| 91 | 651 | 51 | 366 | -15.59 | 208.90 | -20.78 | 132.64 | 0.4665 | |
| 1 | 2 | 0 | 1 | -18.33 | 208.62 | -21.05 | 136.53 | 0.4977 | |
| 0 | 1 | 0 | 1 | -13.65 | 208.71 | -20.96 | 129.08 | 0.4497 | |
| 8 | 50 | 4 | 29 | -18.06 | 208.10 | -21.58 | 135.44 | 0.5004 | |
| 1 | -12 | 1 | -12 | -17.81 | 207.98 | -21.70 | 134.91 | 0.4991 | |
| 1 | -12 | 1 | -12 | -18.12 | 207.86 | -21.82 | 135.22 | 0.5035 | |
| 7 | -9 | 4 | -9 | -15.78 | 207.84 | -21.84 | 131.57 | 0.4804 | |
| 1 | -9 | 0 | -9 | -15.86 | 207.45 | -22.23 | 131.22 | 0.4858 | |
| 0 | 1 | 0 | 1 | -18.17 | 207.23 | -22.45 | 134.52 | 0.5108 | |
| 18 | -9 | 10 | -9 | -16.96 | 207.31 | -22.36 | 132.79 | 0.4979 | |
| 3 | -9 | 2 | -9 | -16.11 | 207.24 | -22.43 | 131.37 | 0.4905 | |
| 0 | 1 | 0 | 1 | -13.85 | 207.35 | -22.33 | 127.73 | 0.4682 | |
| -18 | -9 | -18 | -9 | -16.77 | 206.96 | -22.72 | 132.06 | 0.5000 | |
| 1 | -9 | 1 | -9 | -16.05 | 206.86 | -22.82 | 130.80 | 0.4943 | |
| 0 | 1 | 0 | 0 | -14.68 | 206.89 | -22.79 | 128.60 | 0.4813 | |
| 7 | -9 | 4 | -9 | -16.33 | 206.75 | -22.93 | 131.11 | 0.4983 | |
| 0 | 0 | 0 | 0 | -14.52 | 206.86 | -22.82 | 128.27 | 0.4802 | |
| 0 | 1 | 0 | 0 | -18.04 | 206.50 | -23.18 | 133.44 | 0.5174 | |
| 0 | 3 | 0 | 2 | -17.35 | 206.52 | -23.16 | 132.42 | 0.5105 | |
| 0 | 0 | 0 | 0 | -15.27 | 206.60 | -23.08 | 129.23 | 0.4902 | |
| 0 | 0 | 0 | 0 | -18.21 | 206.30 | -23.38 | 133.44 | 0.5212 | |
| 1 | -9 | 1 | -9 | -16.33 | 206.38 | -23.30 | 130.67 | 0.5025 | |
| 0 | 1 | 0 | 1 | -17.83 | 206.20 | -23.48 | 132.75 | 0.5186 | |
| 0 | 2 | 0 | 1 | -17.31 | 206.22 | -23.46 | 132.00 | 0.5134 | |
| 2 | -9 | 1 | -9 | -16.22 | 206.16 | -23.52 | 130.23 | 0.5040 | |
| 0 | 3 | 0 | 2 | -17.06 | 206.08 | -23.60 | 131.46 | 0.5126 | |
| 1 | 1 | 0 | 0 | -17.82 | 205.94 | -23.74 | 132.44 | 0.5214 | |
| 1 | 3 | 0 | 2 | -16.78 | 205.67 | -24.01 | 130.55 | 0.5148 | |
| 0 | 4 | 0 | 2 | -16.15 | 205.54 | -24.14 | 129.41 | 0.5105 | |
| 0 | 2 | 0 | 1 | -17.47 | 205.32 | -24.36 | 131.21 | 0.5250 | |
| 0 | 2 | 0 | 1 | -15.92 | 205.44 | -24.24 | 128.94 | 0.5096 | |
| 0 | 1 | 0 | 0 | -16.25 | 205.22 | -24.45 | 129.23 | 0.5151 | |
| 0 | 1 | 0 | 1 | -17.46 | 205.09 | -24.59 | 130.94 | 0.5275 | |
| 0 | 1 | 0 | 0 | -16.90 | 205.12 | -24.56 | 130.12 | 0.5221 | |
| 3 | 9 | 2 | 5 | -16.33 | 204.89 | -24.79 | 128.99 | 0.5197 | |
| 0 | 1 | 0 | 0 | -17.42 | 204.74 | -24.94 | 130.49 | 0.5311 | |
| 2 | 6 | 1 | 3 | -16.84 | 204.61 | -25.07 | 129.48 | 0.5274 | |
| 1 | 4 | 1 | 3 | -16.12 | 204.47 | -25.21 | 128.21 | 0.5228 | |
| 0 | 2 | 0 | 1 | -15.78 | 204.15 | -25.53 | 127.33 | 0.5237 | |
| 2 | 445 | 1 | 264 | -17.30 | 203.76 | -25.92 | 129.27 | 0.5412 | |
| 0 | 1 | 0 | 1 | -18.39 | 203.54 | -26.14 | 130.66 | 0.5531 | |
| 3 | -48 | 2 | -48 | -16.94 | 203.68 | -26.00 | 128.65 | 0.5390 | |
| 0 | 3 | 0 | 2 | -15.61 | 203.74 | -25.94 | 126.65 | 0.5271 | |
| 3 | -48 | 2 | -48 | -17.25 | 203.53 | -26.15 | 128.96 | 0.5434 | |
| 0 | 9 | 0 | 5 | -15.81 | 203.65 | -26.03 | 126.87 | 0.5298 | |
| 0 | -48 | 0 | -48 | -17.97 | 203.06 | -26.61 | 129.55 | 0.5547 | |
| 0 | 1 | 0 | 0 | -15.75 | 203.26 | -26.42 | 126.37 | 0.5340 | |
| 32 | -48 | 19 | -48 | -17.25 | 202.79 | -26.89 | 128.22 | 0.5518 | |
| 0 | -48 | 0 | -48 | -17.61 | 202.17 | -27.51 | 128.15 | 0.5619 | |
| 3 | -48 | 2 | -48 | -15.81 | 202.23 | -27.45 | 125.48 | 0.5467 | |
| 4 | -48 | 3 | -48 | -16.89 | 202.06 | -27.61 | 126.97 | 0.5572 | |
| 19 | -48 | 12 | -48 | -17.04 | 201.66 | -28.02 | 126.82 | 0.5631 | |
| 4 | -48 | 2 | -48 | -16.31 | 201.70 | -27.98 | 125.75 | 0.5570 | |
| 4 | -48 | 3 | -48 | -16.61 | 201.37 | -28.30 | 125.90 | 0.5631 | |
| 1 | -48 | 1 | -48 | -15.91 | 201.33 | -28.34 | 124.80 | 0.5582 | |
| 2 | -48 | 1 | -48 | -16.34 | 201.24 | -28.44 | 125.37 | 0.5626 | |
| 1 | -48 | 0 | -48 | -16.08 | 201.27 | -28.41 | 125.01 | 0.5603 | |
| 2 | -48 | 1 | -48 | -16.65 | 201.08 | -28.60 | 125.69 | 0.5668 | |
| 4 | 32 | 3 | 19 | -15.87 | 200.56 | -29.11 | 124.06 | 0.5670 | |
| 0 | -67 | 0 | -67 | -15.51 | 200.58 | -29.10 | 123.52 | 0.5642 | |
| 2 | -67 | 1 | -67 | -15.25 | 200.56 | -29.12 | 123.11 | 0.5626 | |
| 4 | -67 | 3 | -67 | -15.57 | 200.33 | -29.35 | 123.40 | 0.5676 | |
| 0 | 0 | 0 | 0 | -16.02 | 200.26 | -29.42 | 124.02 | 0.5718 | |
| 0 | 1 | 0 | 1 | -16.60 | 200.14 | -29.54 | 124.79 | 0.5775 | |
| 1 | -67 | 1 | -67 | -15.76 | 200.24 | -29.44 | 123.62 | 0.5702 | |
| 0 | 0 | 0 | 0 | -14.85 | 200.31 | -29.36 | 122.27 | 0.5627 | |
| 23 | 95 | 14 | 58 | -17.14 | 200.04 | -29.63 | 125.51 | 0.5826 | |
| 0 | 1 | 0 | 1 | -15.19 | 200.23 | -29.45 | 122.73 | 0.5662 | |
| 0 | 0 | 0 | 0 | -16.25 | 199.99 | -29.69 | 124.13 | 0.5767 | |
| 0 | 0 | 0 | 0 | -14.88 | 200.04 | -29.63 | 122.10 | 0.5663 | |
| 0 | 1 | 0 | 0 | -16.50 | 199.76 | -29.92 | 124.31 | 0.5812 | |
| Proj. U | - Projected umbra area in millionths of solar disc, negative values indicate | |
|
that the umbra consists of fragmented regions which cannot be separated without losing umbral area. In this way several spots (intensity minima in the umbra) have a common umbra, e.g. -2 means that the given spot shares an umbra with spot No.2, and the common U value is indicated at spot No.2. |
||
| Proj. WS | - Projected whole spot area in millionths of solar disc, negative values indicate | |
|
that several umbras have a common penumbra, e.g. -7 means that the given umbra shares a penumbra with umbra No.7, and the WS value is indicated at No.7. |
||
| Corr. U | - Corrected umbra area in millionths of solar hemisphere, for negative values see above | |
| Corr. WS | - Corrected whole spot area in millionths of solar hemisphere, for negative values see above | |
| B | - Heliographic latitude B; positive: North, negative: South | |
| L | - Heliographic longitude L | |
| LCM | - Longitudinal distance from the Sun's central meridian | |
| Pos. angle | - Position angle | |
| r | - Distance from the centre of Sun's disc in terms of Sun's radius | |