Gyula 2012-07-08 07:49:32 UT
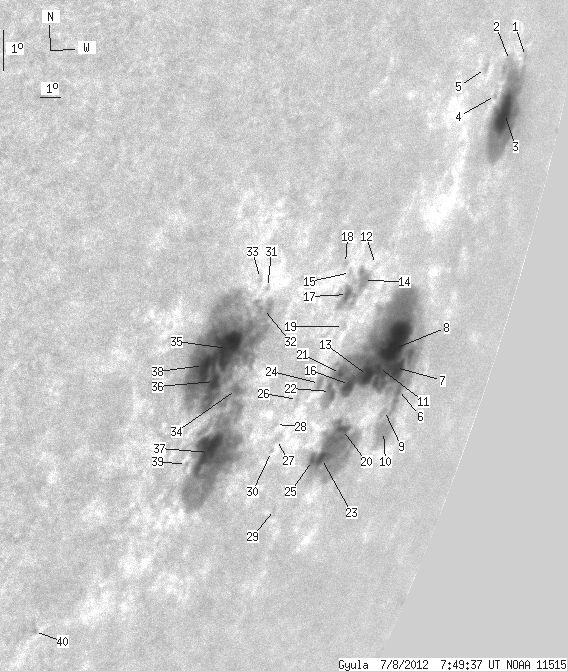
| group | Proj. U | Proj. WS | Corr. U | Corr. WS | B | L | LCM | Pos. angle | r |
| 145 | 860 | 230 | 1358 | -16.69 | 208.36 | 69.54 | 250.93 | 0.9471 | |
|
previous
or next day for the same group /
back to the solar disc Gyula 2012-07-08 07:49:32 UT |
| spot | Proj. U | Proj. WS | Corr. U | Corr. WS | B | L | LCM | Pos. angle | r |
| 0 | 2 | 0 | 5 | -11.28 | 217.03 | 78.21 | 257.77 | 0.9831 | |
| 0 | 2 | 0 | 4 | -11.26 | 215.45 | 76.63 | 257.62 | 0.9778 | |
| 14 | 84 | 34 | 207 | -12.40 | 215.98 | 77.16 | 256.52 | 0.9801 | |
| 0 | 1 | 0 | 3 | -11.94 | 214.75 | 75.93 | 256.85 | 0.9756 | |
| 1 | 2 | 1 | 4 | -11.29 | 213.43 | 74.61 | 257.36 | 0.9701 | |
| 3 | 259 | 6 | 466 | -18.02 | 212.66 | 73.84 | 250.37 | 0.9708 | |
| 38 | -6 | 70 | -6 | -17.50 | 211.88 | 73.06 | 250.79 | 0.9673 | |
| -7 | -6 | -7 | -6 | -17.06 | 211.37 | 72.55 | 251.16 | 0.9648 | |
| 0 | 1 | 0 | 1 | -18.43 | 212.04 | 73.22 | 249.86 | 0.9686 | |
| 0 | 13 | 0 | 27 | -18.92 | 212.51 | 73.69 | 249.44 | 0.9708 | |
| 1 | -6 | 1 | -6 | -17.41 | 210.58 | 71.76 | 250.67 | 0.9616 | |
| 0 | 0 | 0 | 0 | -15.08 | 208.48 | 69.66 | 252.75 | 0.9494 | |
| 4 | -6 | 7 | -6 | -17.54 | 209.95 | 71.13 | 250.44 | 0.9588 | |
| 8 | 34 | 12 | 51 | -15.38 | 207.97 | 69.15 | 252.34 | 0.9470 | |
| 0 | 1 | 0 | 2 | -15.15 | 207.05 | 68.23 | 252.43 | 0.9417 | |
| 5 | -6 | 7 | -6 | -17.66 | 208.88 | 70.06 | 250.13 | 0.9538 | |
| 1 | -14 | 2 | -14 | -15.63 | 207.20 | 68.38 | 251.95 | 0.9430 | |
| 0 | 1 | 0 | 1 | -14.94 | 206.62 | 67.80 | 252.58 | 0.9391 | |
| 0 | 1 | 0 | 2 | -16.33 | 207.46 | 68.64 | 251.27 | 0.9451 | |
| 1 | 73 | 2 | 122 | -18.66 | 209.33 | 70.51 | 249.18 | 0.9568 | |
| 1 | -6 | 2 | -6 | -17.38 | 208.08 | 69.26 | 250.29 | 0.9495 | |
| 2 | -6 | 4 | -6 | -17.74 | 207.78 | 68.96 | 249.86 | 0.9482 | |
| 2 | -20 | 4 | -20 | -19.24 | 208.52 | 69.70 | 248.44 | 0.9535 | |
| 3 | 4 | 4 | 6 | -17.52 | 206.95 | 68.13 | 249.94 | 0.9436 | |
| 0 | -20 | 1 | -20 | -19.24 | 207.97 | 69.15 | 248.33 | 0.9507 | |
| 0 | 1 | 0 | 1 | -17.79 | 205.91 | 67.09 | 249.45 | 0.9381 | |
| 0 | 1 | 0 | 1 | -18.62 | 205.38 | 66.56 | 248.48 | 0.9361 | |
| 0 | 1 | 0 | 1 | -18.28 | 205.06 | 66.24 | 248.78 | 0.9339 | |
| 0 | 2 | 0 | 3 | -20.22 | 206.58 | 67.76 | 247.05 | 0.9446 | |
| 0 | 0 | 0 | 1 | -18.87 | 205.30 | 66.48 | 248.20 | 0.9360 | |
| 0 | 1 | 0 | 1 | -15.19 | 202.71 | 63.89 | 251.57 | 0.9152 | |
| 0 | 10 | 0 | 12 | -15.64 | 202.77 | 63.95 | 251.10 | 0.9161 | |
| 0 | 2 | 0 | 3 | -14.97 | 202.26 | 63.44 | 251.71 | 0.9118 | |
| 2 | 363 | 3 | 433 | -17.35 | 202.46 | 63.64 | 249.20 | 0.9166 | |
| 30 | -34 | 35 | -34 | -16.41 | 201.48 | 62.66 | 249.99 | 0.9086 | |
| 4 | -34 | 5 | -34 | -17.11 | 201.27 | 62.45 | 249.20 | 0.9082 | |
| 25 | -34 | 30 | -34 | -18.68 | 202.00 | 63.18 | 247.68 | 0.9156 | |
| -35 | -34 | -35 | -34 | -16.72 | 200.55 | 61.73 | 249.45 | 0.9026 | |
| 0 | 0 | 0 | 0 | -18.88 | 201.04 | 62.22 | 247.24 | 0.9096 | |
| 0 | 1 | 0 | 1 | -22.27 | 196.54 | 57.72 | 242.35 | 0.8852 | |
| Proj. U | - Projected umbra area in millionths of solar disc, negative values indicate | |
|
that the umbra consists of fragmented regions which cannot be separated without losing umbral area. In this way several spots (intensity minima in the umbra) have a common umbra, e.g. -2 means that the given spot shares an umbra with spot No.2, and the common U value is indicated at spot No.2. |
||
| Proj. WS | - Projected whole spot area in millionths of solar disc, negative values indicate | |
|
that several umbras have a common penumbra, e.g. -7 means that the given umbra shares a penumbra with umbra No.7, and the WS value is indicated at No.7. |
||
| Corr. U | - Corrected umbra area in millionths of solar hemisphere, for negative values see above | |
| Corr. WS | - Corrected whole spot area in millionths of solar hemisphere, for negative values see above | |
| B | - Heliographic latitude B; positive: North, negative: South | |
| L | - Heliographic longitude L | |
| LCM | - Longitudinal distance from the Sun's central meridian | |
| Pos. angle | - Position angle | |
| r | - Distance from the centre of Sun's disc in terms of Sun's radius | |