SDO HMI 2016-02-09 06:46:10 UT
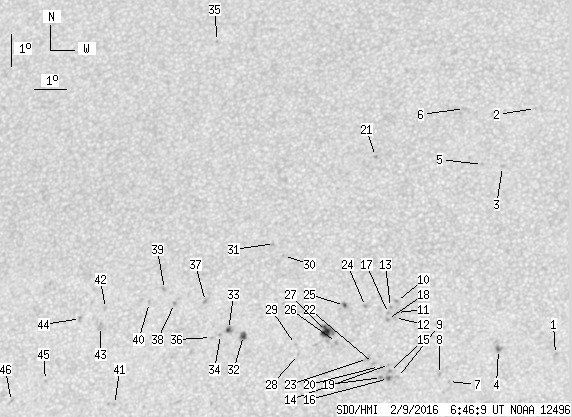
| group | Proj. U | Proj. WS | Corr. U | Corr. WS | B | L | LCM | Pos. angle | r |
| 13 | 79 | 6 | 43 | 8.36 | 101.79 | -15.32 | 45.32 | 0.3686 | |
|
previous
or next day for the same group /
back to the solar disc SDO HMI 2016-02-09 06:46:10 UT |
| spot | Proj. U | Proj. WS | Corr. U | Corr. WS | B | L | LCM | Pos. angle | r |
| 0 | 2 | 0 | 1 | 6.98 | 109.43 | -7.68 | 29.72 | 0.2687 | |
| 0 | 1 | 0 | 0 | 14.62 | 108.61 | -8.50 | 21.70 | 0.3885 | |
| 0 | 2 | 0 | 1 | 12.81 | 107.66 | -9.45 | 25.91 | 0.3679 | |
| 1 | 2 | 0 | 1 | 7.16 | 107.71 | -9.40 | 34.61 | 0.2867 | |
| 0 | 1 | 0 | 1 | 12.88 | 107.04 | -10.07 | 27.28 | 0.3734 | |
| 0 | 2 | 0 | 1 | 14.66 | 106.40 | -10.71 | 26.57 | 0.4036 | |
| 0 | 1 | 0 | 0 | 6.22 | 106.21 | -10.89 | 40.71 | 0.2894 | |
| 0 | 1 | 0 | 1 | 6.43 | 105.94 | -11.17 | 40.94 | 0.2952 | |
| 0 | 2 | 0 | 1 | 6.37 | 104.66 | -12.45 | 44.18 | 0.3088 | |
| 0 | 1 | 0 | 1 | 8.69 | 104.56 | -12.55 | 39.59 | 0.3385 | |
| 0 | 1 | 0 | 0 | 8.36 | 104.57 | -12.54 | 40.21 | 0.3341 | |
| 0 | 1 | 0 | 0 | 8.20 | 104.51 | -12.59 | 40.64 | 0.3328 | |
| 0 | 1 | 0 | 1 | 8.51 | 104.38 | -12.73 | 40.33 | 0.3381 | |
| 0 | 1 | 0 | 0 | 6.77 | 104.40 | -12.70 | 43.87 | 0.3165 | |
| 0 | 1 | 0 | 1 | 6.56 | 104.41 | -12.70 | 44.33 | 0.3139 | |
| 1 | 2 | 0 | 1 | 6.35 | 104.39 | -12.72 | 44.86 | 0.3117 | |
| 0 | 1 | 0 | 1 | 8.33 | 104.33 | -12.78 | 40.81 | 0.3364 | |
| 0 | 1 | 0 | 1 | 8.15 | 104.30 | -12.81 | 41.23 | 0.3344 | |
| 0 | 1 | 0 | 1 | 6.39 | 104.17 | -12.94 | 45.27 | 0.3146 | |
| 0 | 1 | 0 | 0 | 6.72 | 104.10 | -13.01 | 44.67 | 0.3194 | |
| 0 | 1 | 0 | 1 | 13.21 | 103.71 | -13.40 | 34.00 | 0.4053 | |
| 0 | 2 | 0 | 1 | 6.82 | 103.91 | -13.19 | 44.87 | 0.3227 | |
| 0 | 3 | 0 | 1 | 6.97 | 103.73 | -13.38 | 44.94 | 0.3267 | |
| 0 | 1 | 0 | 1 | 8.56 | 103.61 | -13.50 | 41.91 | 0.3470 | |
| 1 | 2 | 0 | 1 | 8.61 | 102.96 | -14.15 | 43.16 | 0.3548 | |
| 0 | 1 | 0 | 1 | 7.49 | 102.76 | -14.35 | 45.86 | 0.3440 | |
| 7 | 13 | 4 | 7 | 7.83 | 102.44 | -14.67 | 45.78 | 0.3517 | |
| 0 | 1 | 0 | 0 | 7.16 | 101.60 | -15.51 | 48.80 | 0.3543 | |
| 0 | 1 | 0 | 0 | 7.47 | 101.49 | -15.62 | 48.34 | 0.3589 | |
| 0 | 1 | 0 | 0 | 10.21 | 100.99 | -16.11 | 43.94 | 0.3954 | |
| 0 | 0 | 0 | 0 | 10.59 | 100.69 | -16.42 | 43.80 | 0.4031 | |
| 2 | 4 | 1 | 2 | 7.79 | 99.86 | -17.25 | 50.51 | 0.3824 | |
| 1 | 3 | 1 | 2 | 7.99 | 99.38 | -17.73 | 50.88 | 0.3904 | |
| 0 | 1 | 0 | 1 | 7.85 | 99.14 | -17.97 | 51.56 | 0.3920 | |
| 0 | 1 | 0 | 0 | 17.05 | 98.36 | -18.75 | 37.95 | 0.5018 | |
| 0 | 1 | 0 | 1 | 7.77 | 98.86 | -18.25 | 52.15 | 0.3947 | |
| 0 | 2 | 0 | 1 | 8.88 | 98.61 | -18.50 | 50.36 | 0.4088 | |
| 0 | 2 | 0 | 1 | 8.85 | 97.63 | -19.48 | 51.86 | 0.4207 | |
| 0 | 1 | 0 | 1 | 9.30 | 97.29 | -19.82 | 51.53 | 0.4292 | |
| 0 | 1 | 0 | 1 | 8.92 | 96.83 | -20.28 | 52.87 | 0.4313 | |
| 0 | 1 | 0 | 1 | 5.85 | 95.87 | -21.24 | 60.19 | 0.4172 | |
| 0 | 2 | 0 | 1 | 8.79 | 95.43 | -21.68 | 54.95 | 0.4479 | |
| 0 | 4 | 0 | 2 | 8.25 | 95.30 | -21.81 | 56.13 | 0.4447 | |
| 0 | 2 | 0 | 1 | 8.52 | 94.64 | -22.47 | 56.42 | 0.4556 | |
| 0 | 1 | 0 | 1 | 6.68 | 93.60 | -23.50 | 61.07 | 0.4545 | |
| 0 | 1 | 0 | 0 | 6.09 | 92.52 | -24.58 | 63.30 | 0.4650 | |
| Proj. U | - Projected umbra area in millionths of solar disc, negative values indicate | |
|
that the umbra consists of fragmented regions which cannot be separated without losing umbral area. In this way several spots (intensity minima in the umbra) have a common umbra, e.g. -2 means that the given spot shares an umbra with spot No.2, and the common U value is indicated at spot No.2. |
||
| Proj. WS | - Projected whole spot area in millionths of solar disc, negative values indicate | |
|
that several umbras have a common penumbra, e.g. -7 means that the given umbra shares a penumbra with umbra No.7, and the WS value is indicated at No.7. |
||
| Corr. U | - Corrected umbra area in millionths of solar hemisphere, for negative values see above | |
| Corr. WS | - Corrected whole spot area in millionths of solar hemisphere, for negative values see above | |
| B | - Heliographic latitude B; positive: North, negative: South | |
| L | - Heliographic longitude L | |
| LCM | - Longitudinal distance from the Sun's central meridian | |
| Pos. angle | - Position angle | |
| r | - Distance from the centre of Sun's disc in terms of Sun's radius | |