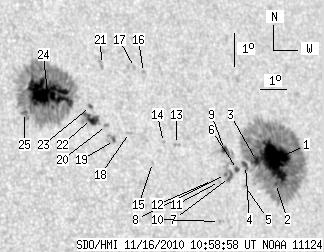
SDO HMI 2010-11-16 10:58:58 UT
See sunspots with tool (Click here to study sunspot positions and configurations with tool using white-light and magnetogram images and polarity drawing)
(It is recommended to set high resolution on your display!)
| group | Proj. U | Proj. WS | Corr. U | Corr. WS | B | L | LCM | Pos. angle | r | MU | MP |
| 164.61 | 708.64 | 103.53 | 448.28 | 13.71 | 172.55 | 37.08 | 289.17 | 0.6212 | -35.2 | -17.0 | |
|
previous
or next observation for the same group /
back to the solar disc SDO HMI 2010-11-16 10:58:58 UT
See sunspots with tool (Click here to study sunspot positions and configurations with tool using white-light and magnetogram images and polarity drawing) (It is recommended to set high resolution on your display!) |
| spot | Proj. U | Proj. WS | Corr. U | Corr. WS | B | L | LCM | Pos. angle | r | MU | MP |
| 64.87 | 359.38 | 42.84 | 237.31 | 12.83 | 176.09 | 40.62 | 286.42 | 0.6641 | -1117.5 | -260.1 | |
| 0.86 | -1.00 | 0.57 | -1.00 | 12.11 | 175.95 | 40.48 | 285.39 | 0.6607 | -978.0 | 999999 | |
| 3.87 | -1.00 | 2.53 | -1.00 | 12.82 | 175.33 | 39.86 | 286.62 | 0.6545 | -1203.6 | 999999 | |
| 3.26 | -1.00 | 2.12 | -1.00 | 12.68 | 174.87 | 39.40 | 286.55 | 0.6483 | -946.4 | 999999 | |
| 0.00 | 0.77 | 0.00 | 0.50 | 12.05 | 174.75 | 39.28 | 285.62 | 0.6453 | -728.0 | -649.3 | |
| 2.06 | 18.30 | 1.33 | 11.77 | 12.57 | 174.53 | 39.06 | 286.48 | 0.6437 | -768.7 | -671.9 | |
| 3.78 | -6.00 | 2.43 | -6.00 | 12.34 | 174.18 | 38.71 | 286.22 | 0.6385 | -803.2 | 999999 | |
| 1.03 | -6.00 | 0.66 | -6.00 | 12.44 | 174.04 | 38.57 | 286.41 | 0.6370 | -897.3 | 999999 | |
| 2.92 | 10.83 | 1.88 | 6.96 | 13.19 | 174.14 | 38.67 | 287.54 | 0.6403 | -860.4 | -567.0 | |
| 0.00 | 1.12 | 0.00 | 0.71 | 11.04 | 173.57 | 38.10 | 284.35 | 0.6275 | -615.0 | -548.5 | |
| 0.00 | 1.46 | 0.00 | 0.93 | 12.23 | 173.77 | 38.30 | 286.18 | 0.6330 | -579.0 | -502.1 | |
| 0.00 | 0.95 | 0.00 | 0.60 | 12.27 | 173.50 | 38.04 | 286.31 | 0.6296 | -752.0 | -658.2 | |
| 0.00 | 2.15 | 0.00 | 1.35 | 13.39 | 172.32 | 36.85 | 288.47 | 0.6174 | 689.0 | 429.1 | |
| 0.00 | 1.12 | 0.00 | 0.70 | 13.46 | 171.84 | 36.37 | 288.76 | 0.6113 | 561.0 | 466.1 | |
| 0.00 | 0.95 | 0.00 | 0.59 | 12.87 | 171.32 | 35.85 | 288.00 | 0.6026 | 423.0 | 410.6 | |
| 0.00 | 1.63 | 0.00 | 1.02 | 15.60 | 171.48 | 36.01 | 292.29 | 0.6143 | 657.0 | 514.0 | |
| 0.00 | 1.89 | 0.00 | 1.18 | 15.76 | 171.17 | 35.70 | 292.68 | 0.6110 | 650.0 | 553.7 | |
| 0.00 | 2.23 | 0.00 | 1.38 | 13.80 | 170.61 | 35.15 | 289.78 | 0.5963 | 651.0 | 459.8 | |
| 1.03 | 4.12 | 0.63 | 2.52 | 13.57 | 170.02 | 34.55 | 289.65 | 0.5876 | -670.9 | -49.8 | |
| 0.00 | 1.89 | 0.00 | 1.15 | 14.03 | 169.80 | 34.33 | 290.51 | 0.5864 | 631.0 | 456.3 | |
| 0.00 | 3.44 | 0.00 | 2.11 | 15.88 | 169.95 | 34.48 | 293.45 | 0.5958 | 731.0 | 566.7 | |
| 9.71 | 15.89 | 5.89 | 9.64 | 14.26 | 169.28 | 33.81 | 291.11 | 0.5804 | 865.9 | 503.8 | |
| 1.29 | 1.55 | 0.78 | 0.94 | 14.62 | 169.31 | 33.84 | 291.70 | 0.5822 | 644.7 | 653.3 | |
| 67.87 | 278.97 | 40.65 | 166.92 | 15.05 | 167.81 | 32.34 | 293.18 | 0.5641 | 1129.9 | 369.3 | |
| 2.06 | -24.00 | 1.22 | -24.00 | 14.50 | 166.88 | 31.41 | 292.73 | 0.5493 | 953.6 | 999999 | |
| Proj. U | - Projected umbra area in millionths of solar disc, negative values indicate | |
|
that the umbra consists of fragmented regions which cannot be separated without losing umbral area. In this way several spots (intensity minima in the umbra) have a common umbra, e.g. -2 means that the given spot shares an umbra with spot No.2, and the common U value is indicated at spot No.2. |
||
| Proj. WS | - Projected whole spot area in millionths of solar disc, negative values indicate | |
|
that several umbras have a common penumbra, e.g. -7 means that the given umbra shares a penumbra with umbra No.7, and the WS value is indicated at No.7. |
||
| Corr. U | - Corrected umbra area in millionths of solar hemisphere, for negative values see above | |
| Corr. WS | - Corrected whole spot area in millionths of solar hemisphere, for negative values see above | |
| B | - Heliographic latitude B; positive: North, negative: South | |
| L | - Heliographic longitude L | |
| LCM | - Longitudinal distance from the Sun's central meridian | |
| Pos. angle | - Position angle | |
| r | - Distance from the centre of Sun's disc in terms of Sun's radius | |
| MU | - Mean magnetic field within the umbra contour averaged the pixel values with sign. | |
| MP | - Mean magnetic field within the penumbra contour averaged the pixel values with sign. | |