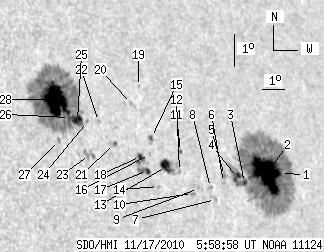
SDO HMI 2010-11-17 05:58:58 UT
See sunspots with tool (Click here to study sunspot positions and configurations with tool using white-light and magnetogram images and polarity drawing)
(It is recommended to set high resolution on your display!)
| group | Proj. U | Proj. WS | Corr. U | Corr. WS | B | L | LCM | Pos. angle | r | MU | MP |
| 134.54 | 632.93 | 100.48 | 476.07 | 13.79 | 172.97 | 47.95 | 286.31 | 0.7520 | -19.4 | -24.1 | |
|
previous
or next observation for the same group /
back to the solar disc SDO HMI 2010-11-17 05:58:58 UT
See sunspots with tool (Click here to study sunspot positions and configurations with tool using white-light and magnetogram images and polarity drawing) (It is recommended to set high resolution on your display!) |
| spot | Proj. U | Proj. WS | Corr. U | Corr. WS | B | L | LCM | Pos. angle | r | MU | MP |
| 0.26 | 331.72 | 0.21 | 266.38 | 12.88 | 177.22 | 52.21 | 284.24 | 0.7971 | 70.3 | -268.2 | |
| 56.10 | -1.00 | 45.12 | -1.00 | 12.90 | 176.54 | 51.52 | 284.37 | 0.7900 | -999.6 | 999999 | |
| 2.15 | -1.00 | 1.69 | -1.00 | 12.67 | 175.40 | 50.39 | 284.25 | 0.7778 | -812.0 | 999999 | |
| 3.69 | -1.00 | 2.88 | -1.00 | 12.83 | 175.11 | 50.10 | 284.50 | 0.7749 | -833.1 | 999999 | |
| 0.00 | 2.84 | 0.00 | 2.19 | 12.91 | 174.52 | 49.50 | 284.70 | 0.7686 | -841.0 | -725.9 | |
| 0.00 | 1.29 | 0.00 | 0.99 | 12.70 | 174.42 | 49.40 | 284.45 | 0.7672 | -701.0 | -528.0 | |
| 0.00 | 1.46 | 0.00 | 1.11 | 12.20 | 173.92 | 48.90 | 283.88 | 0.7610 | -566.0 | -485.6 | |
| 0.00 | 1.37 | 0.00 | 1.04 | 12.57 | 173.78 | 48.76 | 284.38 | 0.7600 | -752.0 | -664.1 | |
| 0.00 | 0.86 | 0.00 | 0.65 | 12.56 | 173.22 | 48.20 | 284.46 | 0.7539 | -716.0 | -628.4 | |
| 0.00 | 2.15 | 0.00 | 1.60 | 12.42 | 172.91 | 47.90 | 284.33 | 0.7502 | -742.0 | -597.1 | |
| 0.95 | 1.80 | 0.70 | 1.35 | 13.70 | 172.70 | 47.68 | 286.06 | 0.7499 | -529.6 | -475.6 | |
| 0.00 | 1.46 | 0.00 | 1.08 | 13.10 | 172.49 | 47.48 | 285.31 | 0.7466 | 328.0 | 261.7 | |
| 9.62 | 13.15 | 7.07 | 9.66 | 13.26 | 171.95 | 46.93 | 285.64 | 0.7408 | 700.9 | 325.4 | |
| 0.00 | 1.29 | 0.00 | 0.94 | 12.68 | 171.45 | 46.43 | 284.95 | 0.7340 | 410.0 | 357.1 | |
| 1.89 | 3.09 | 1.38 | 2.26 | 14.16 | 171.51 | 46.50 | 286.93 | 0.7375 | 481.2 | 406.4 | |
| 0.00 | 1.20 | 0.00 | 0.87 | 13.65 | 171.29 | 46.27 | 286.29 | 0.7340 | 667.0 | 576.7 | |
| 2.49 | 6.79 | 1.80 | 4.89 | 13.17 | 171.08 | 46.07 | 285.69 | 0.7307 | 791.1 | 333.4 | |
| 1.80 | 6.01 | 1.30 | 4.33 | 13.60 | 170.88 | 45.86 | 286.32 | 0.7292 | -564.1 | -122.2 | |
| 0.00 | 1.20 | 0.00 | 0.88 | 15.72 | 171.37 | 46.35 | 289.05 | 0.7393 | 360.0 | 316.1 | |
| 0.00 | 1.12 | 0.00 | 0.81 | 15.21 | 170.91 | 45.90 | 288.49 | 0.7330 | 533.0 | 440.5 | |
| 1.03 | 3.01 | 0.73 | 2.13 | 14.03 | 169.85 | 44.84 | 287.14 | 0.7182 | 574.4 | 280.0 | |
| 0.00 | 1.55 | 0.00 | 1.09 | 14.71 | 169.34 | 44.32 | 288.21 | 0.7138 | 668.0 | 481.1 | |
| 0.00 | 7.30 | 0.00 | 5.08 | 13.73 | 168.71 | 43.69 | 287.01 | 0.7041 | 536.0 | 500.2 | |
| 0.00 | 1.37 | 0.00 | 0.96 | 14.73 | 168.87 | 43.85 | 288.36 | 0.7083 | 464.0 | 320.2 | |
| 6.79 | 238.84 | 4.72 | 164.37 | 14.80 | 168.46 | 43.45 | 288.57 | 0.7037 | 672.4 | 361.7 | |
| 1.89 | -25.00 | 1.31 | -25.00 | 14.87 | 168.14 | 43.13 | 288.76 | 0.7001 | 612.4 | 999999 | |
| 0.00 | 2.06 | 0.00 | 1.41 | 14.19 | 167.56 | 42.54 | 287.96 | 0.6914 | 696.0 | 553.7 | |
| 45.88 | -25.00 | 31.57 | -25.00 | 15.43 | 167.70 | 42.68 | 289.68 | 0.6963 | 1135.6 | 999999 | |
| Proj. U | - Projected umbra area in millionths of solar disc, negative values indicate | |
|
that the umbra consists of fragmented regions which cannot be separated without losing umbral area. In this way several spots (intensity minima in the umbra) have a common umbra, e.g. -2 means that the given spot shares an umbra with spot No.2, and the common U value is indicated at spot No.2. |
||
| Proj. WS | - Projected whole spot area in millionths of solar disc, negative values indicate | |
|
that several umbras have a common penumbra, e.g. -7 means that the given umbra shares a penumbra with umbra No.7, and the WS value is indicated at No.7. |
||
| Corr. U | - Corrected umbra area in millionths of solar hemisphere, for negative values see above | |
| Corr. WS | - Corrected whole spot area in millionths of solar hemisphere, for negative values see above | |
| B | - Heliographic latitude B; positive: North, negative: South | |
| L | - Heliographic longitude L | |
| LCM | - Longitudinal distance from the Sun's central meridian | |
| Pos. angle | - Position angle | |
| r | - Distance from the centre of Sun's disc in terms of Sun's radius | |
| MU | - Mean magnetic field within the umbra contour averaged the pixel values with sign. | |
| MP | - Mean magnetic field within the penumbra contour averaged the pixel values with sign. | |