SDO HMI 2010-11-17 07:58:58 UT
See sunspots with tool (Click here to study sunspot positions and configurations with tool using white-light and magnetogram images and polarity drawing)
(It is recommended to set high resolution on your display!)
| group | Proj. U | Proj. WS | Corr. U | Corr. WS | B | L | LCM | Pos. angle | r | MU | MP |
| 126.97 | 631.68 | 97.44 | 486.11 | 13.78 | 172.94 | 49.02 | 286.09 | 0.7637 | -70.7 | 3.0 | |
|
previous
or next observation for the same group /
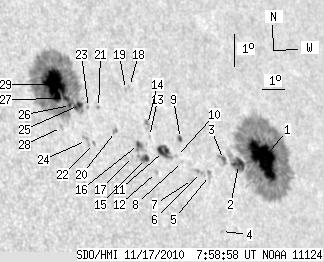
back to the solar disc SDO HMI 2010-11-17 07:58:58 UT
See sunspots with tool (Click here to study sunspot positions and configurations with tool using white-light and magnetogram images and polarity drawing) (It is recommended to set high resolution on your display!) |
| spot | Proj. U | Proj. WS | Corr. U | Corr. WS | B | L | LCM | Pos. angle | r | MU | MP |
| 51.54 | 326.36 | 42.51 | 269.07 | 12.91 | 176.59 | 52.67 | 284.23 | 0.8018 | -1007.6 | -226.6 | |
| 11.00 | -1.00 | 8.81 | -1.00 | 12.77 | 175.31 | 51.38 | 284.24 | 0.7885 | -881.8 | 999999 | |
| 2.41 | 5.67 | 1.90 | 4.48 | 12.95 | 174.63 | 50.70 | 284.57 | 0.7816 | -825.3 | -648.7 | |
| 0.00 | 0.86 | 0.00 | 0.67 | 10.79 | 173.98 | 50.06 | 281.90 | 0.7720 | -389.0 | -439.3 | |
| 0.00 | 4.21 | 0.00 | 3.27 | 12.49 | 173.83 | 49.91 | 284.10 | 0.7724 | -721.0 | -583.6 | |
| 0.00 | 4.04 | 0.00 | 3.11 | 12.59 | 173.44 | 49.51 | 284.30 | 0.7683 | -650.0 | -588.7 | |
| 0.00 | 1.37 | 0.00 | 1.05 | 12.40 | 173.01 | 49.09 | 284.11 | 0.7634 | -753.0 | -616.1 | |
| 0.00 | 0.86 | 0.00 | 0.65 | 12.95 | 172.69 | 48.77 | 284.89 | 0.7607 | 191.0 | 148.4 | |
| 1.72 | 2.58 | 1.31 | 1.97 | 13.64 | 172.79 | 48.86 | 285.78 | 0.7628 | -551.9 | -424.0 | |
| 0.00 | 1.29 | 0.00 | 0.98 | 13.11 | 172.45 | 48.53 | 285.14 | 0.7584 | 350.0 | 238.9 | |
| 9.45 | 12.97 | 7.08 | 9.72 | 13.28 | 171.90 | 47.98 | 285.47 | 0.7525 | 682.9 | 411.7 | |
| 0.00 | 1.29 | 0.00 | 0.96 | 12.66 | 171.43 | 47.50 | 284.74 | 0.7462 | 585.0 | 428.3 | |
| 0.00 | 0.94 | 0.00 | 0.70 | 13.75 | 171.39 | 47.46 | 286.19 | 0.7477 | 472.0 | 415.7 | |
| 0.00 | 3.87 | 0.00 | 2.87 | 14.11 | 171.40 | 47.47 | 286.67 | 0.7484 | 522.0 | 427.0 | |
| 4.04 | 6.70 | 2.97 | 4.93 | 13.09 | 171.04 | 47.11 | 285.39 | 0.7425 | 668.3 | 198.2 | |
| 1.12 | 6.53 | 0.82 | 4.80 | 13.53 | 170.83 | 46.91 | 286.01 | 0.7410 | -622.1 | 17.9 | |
| 0.00 | 1.12 | 0.00 | 0.81 | 13.17 | 170.48 | 46.55 | 285.61 | 0.7363 | -416.0 | -320.5 | |
| 0.00 | 0.69 | 0.00 | 0.51 | 15.29 | 170.92 | 46.99 | 288.33 | 0.7454 | 540.0 | 447.4 | |
| 0.00 | 0.86 | 0.00 | 0.63 | 15.20 | 170.71 | 46.79 | 288.27 | 0.7430 | 561.0 | 475.2 | |
| 0.00 | 3.01 | 0.00 | 2.18 | 13.95 | 169.92 | 46.00 | 286.77 | 0.7315 | 705.0 | 447.5 | |
| 0.00 | 1.20 | 0.00 | 0.86 | 14.70 | 169.37 | 45.44 | 287.92 | 0.7267 | 547.0 | 435.2 | |
| 0.00 | 1.63 | 0.00 | 1.16 | 13.62 | 168.92 | 44.99 | 286.55 | 0.7192 | 438.0 | 293.8 | |
| 0.00 | 1.29 | 0.00 | 0.92 | 14.71 | 168.94 | 45.01 | 288.04 | 0.7218 | 403.0 | 295.3 | |
| 0.00 | 4.12 | 0.00 | 2.91 | 13.72 | 168.60 | 44.67 | 286.76 | 0.7157 | 399.0 | 510.5 | |
| 4.12 | 236.33 | 2.92 | 165.58 | 14.78 | 168.52 | 44.60 | 288.25 | 0.7172 | 563.0 | 367.2 | |
| 1.20 | -25.00 | 0.85 | -25.00 | 14.79 | 168.18 | 44.25 | 288.36 | 0.7132 | 651.3 | 999999 | |
| 1.37 | -25.00 | 0.97 | -25.00 | 15.01 | 168.02 | 44.10 | 288.70 | 0.7119 | 746.4 | 999999 | |
| 0.00 | 1.89 | 0.00 | 1.32 | 14.14 | 167.63 | 43.71 | 287.59 | 0.7053 | 584.0 | 441.4 | |
| 39.00 | -25.00 | 27.30 | -25.00 | 15.45 | 167.67 | 43.74 | 289.40 | 0.7089 | 1176.9 | 999999 | |
| Proj. U | - Projected umbra area in millionths of solar disc, negative values indicate | |
|
that the umbra consists of fragmented regions which cannot be separated without losing umbral area. In this way several spots (intensity minima in the umbra) have a common umbra, e.g. -2 means that the given spot shares an umbra with spot No.2, and the common U value is indicated at spot No.2. |
||
| Proj. WS | - Projected whole spot area in millionths of solar disc, negative values indicate | |
|
that several umbras have a common penumbra, e.g. -7 means that the given umbra shares a penumbra with umbra No.7, and the WS value is indicated at No.7. |
||
| Corr. U | - Corrected umbra area in millionths of solar hemisphere, for negative values see above | |
| Corr. WS | - Corrected whole spot area in millionths of solar hemisphere, for negative values see above | |
| B | - Heliographic latitude B; positive: North, negative: South | |
| L | - Heliographic longitude L | |
| LCM | - Longitudinal distance from the Sun's central meridian | |
| Pos. angle | - Position angle | |
| r | - Distance from the centre of Sun's disc in terms of Sun's radius | |
| MU | - Mean magnetic field within the umbra contour averaged the pixel values with sign. | |
| MP | - Mean magnetic field within the penumbra contour averaged the pixel values with sign. | |