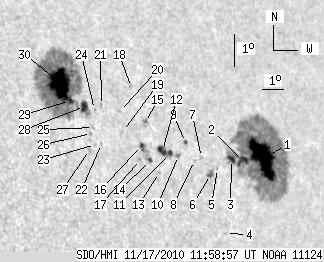
SDO HMI 2010-11-17 11:58:57 UT
See sunspots with tool (Click here to study sunspot positions and configurations with tool using white-light and magnetogram images and polarity drawing)
(It is recommended to set high resolution on your display!)
| group | Proj. U | Proj. WS | Corr. U | Corr. WS | B | L | LCM | Pos. angle | r | MU | MP |
| 123.89 | 595.89 | 99.77 | 480.32 | 13.82 | 173.03 | 51.29 | 285.75 | 0.7877 | -81.2 | 13.9 | |
|
previous
or next observation for the same group /
back to the solar disc SDO HMI 2010-11-17 11:58:57 UT
See sunspots with tool (Click here to study sunspot positions and configurations with tool using white-light and magnetogram images and polarity drawing) (It is recommended to set high resolution on your display!) |
| spot | Proj. U | Proj. WS | Corr. U | Corr. WS | B | L | LCM | Pos. angle | r | MU | MP |
| 53.67 | 316.24 | 46.69 | 274.67 | 12.90 | 176.66 | 54.92 | 283.94 | 0.8241 | -926.2 | -209.4 | |
| 6.35 | -1.00 | 5.39 | -1.00 | 12.88 | 175.60 | 53.87 | 284.05 | 0.8138 | -903.6 | 999999 | |
| 3.52 | -1.00 | 2.95 | -1.00 | 12.93 | 175.05 | 53.31 | 284.18 | 0.8084 | -909.3 | 999999 | |
| 0.00 | 0.94 | 0.00 | 0.77 | 10.73 | 174.14 | 52.40 | 281.55 | 0.7968 | -529.0 | -479.1 | |
| 0.00 | 0.77 | 0.00 | 0.64 | 12.69 | 174.27 | 52.53 | 283.98 | 0.8002 | -628.0 | -550.3 | |
| 1.46 | 4.04 | 1.19 | 3.29 | 12.52 | 173.87 | 52.13 | 283.83 | 0.7959 | -792.1 | -677.6 | |
| 0.00 | 1.20 | 0.00 | 0.97 | 13.04 | 173.58 | 51.84 | 284.53 | 0.7936 | 244.0 | 151.4 | |
| 0.00 | 1.20 | 0.00 | 0.97 | 12.96 | 173.21 | 51.47 | 284.48 | 0.7896 | 337.0 | 205.9 | |
| 1.20 | 1.46 | 0.96 | 1.17 | 13.52 | 172.93 | 51.19 | 285.23 | 0.7875 | -491.4 | -470.7 | |
| 0.00 | 2.23 | 0.00 | 1.77 | 13.14 | 172.48 | 50.74 | 284.82 | 0.7823 | 434.0 | 313.3 | |
| 2.49 | 11.51 | 1.96 | 9.00 | 13.21 | 172.12 | 50.38 | 284.97 | 0.7785 | 510.5 | 442.1 | |
| 5.75 | -11.00 | 4.49 | -11.00 | 13.32 | 171.76 | 50.02 | 285.16 | 0.7749 | 644.5 | 999999 | |
| 0.00 | 0.94 | 0.00 | 0.73 | 12.66 | 171.44 | 49.70 | 284.37 | 0.7705 | 376.0 | 349.7 | |
| 1.37 | 3.86 | 1.06 | 2.97 | 13.03 | 171.12 | 49.38 | 284.91 | 0.7675 | 750.8 | 601.3 | |
| 0.00 | 3.09 | 0.00 | 2.39 | 14.18 | 171.21 | 49.47 | 286.38 | 0.7704 | 679.0 | 522.4 | |
| 1.72 | 5.15 | 1.32 | 3.95 | 13.50 | 170.82 | 49.08 | 285.57 | 0.7651 | -463.8 | 231.9 | |
| 0.00 | 0.86 | 0.00 | 0.65 | 13.08 | 170.66 | 48.92 | 285.05 | 0.7627 | -508.0 | -434.6 | |
| 0.00 | 0.77 | 0.00 | 0.60 | 15.26 | 170.88 | 49.14 | 287.83 | 0.7688 | 431.0 | 430.6 | |
| 0.00 | 1.03 | 0.00 | 0.78 | 13.95 | 170.07 | 48.33 | 286.30 | 0.7576 | 463.0 | 435.5 | |
| 0.00 | 0.86 | 0.00 | 0.65 | 14.56 | 170.10 | 48.36 | 287.08 | 0.7591 | 403.0 | 321.1 | |
| 0.00 | 1.46 | 0.00 | 1.09 | 14.76 | 169.33 | 47.59 | 287.52 | 0.7511 | 483.0 | 379.6 | |
| 0.00 | 0.77 | 0.00 | 0.57 | 13.62 | 169.02 | 47.28 | 286.07 | 0.7454 | 360.0 | 304.0 | |
| 0.00 | 1.29 | 0.00 | 0.95 | 13.60 | 168.74 | 47.00 | 286.10 | 0.7422 | 500.0 | 368.1 | |
| 0.00 | 1.03 | 0.00 | 0.76 | 14.65 | 168.98 | 47.24 | 287.45 | 0.7470 | 150.0 | 187.1 | |
| 0.00 | 0.86 | 0.00 | 0.63 | 14.11 | 168.79 | 47.05 | 286.77 | 0.7437 | 483.0 | 405.1 | |
| 0.00 | 1.12 | 0.00 | 0.82 | 13.93 | 168.65 | 46.91 | 286.57 | 0.7419 | 681.0 | 548.2 | |
| 0.00 | 2.06 | 0.00 | 1.51 | 13.45 | 168.44 | 46.70 | 285.97 | 0.7385 | -282.0 | -150.6 | |
| 5.84 | 11.68 | 4.30 | 8.60 | 14.76 | 168.56 | 46.82 | 287.68 | 0.7425 | 542.0 | 397.8 | |
| 1.97 | 219.47 | 1.44 | 159.42 | 14.96 | 167.99 | 46.25 | 288.09 | 0.7365 | 711.8 | 342.1 | |
| 38.55 | -29.00 | 28.02 | -29.00 | 15.49 | 167.70 | 45.96 | 288.87 | 0.7344 | 1111.1 | 999999 | |
| Proj. U | - Projected umbra area in millionths of solar disc, negative values indicate | |
|
that the umbra consists of fragmented regions which cannot be separated without losing umbral area. In this way several spots (intensity minima in the umbra) have a common umbra, e.g. -2 means that the given spot shares an umbra with spot No.2, and the common U value is indicated at spot No.2. |
||
| Proj. WS | - Projected whole spot area in millionths of solar disc, negative values indicate | |
|
that several umbras have a common penumbra, e.g. -7 means that the given umbra shares a penumbra with umbra No.7, and the WS value is indicated at No.7. |
||
| Corr. U | - Corrected umbra area in millionths of solar hemisphere, for negative values see above | |
| Corr. WS | - Corrected whole spot area in millionths of solar hemisphere, for negative values see above | |
| B | - Heliographic latitude B; positive: North, negative: South | |
| L | - Heliographic longitude L | |
| LCM | - Longitudinal distance from the Sun's central meridian | |
| Pos. angle | - Position angle | |
| r | - Distance from the centre of Sun's disc in terms of Sun's radius | |
| MU | - Mean magnetic field within the umbra contour averaged the pixel values with sign. | |
| MP | - Mean magnetic field within the penumbra contour averaged the pixel values with sign. | |