SDO HMI 2010-11-17 22:58:57 UT
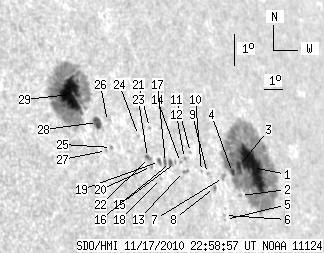
See sunspots with tool (Click here to study sunspot positions and configurations with tool using white-light and magnetogram images and polarity drawing)
(It is recommended to set high resolution on your display!)
| group | Proj. U | Proj. WS | Corr. U | Corr. WS | B | L | LCM | Pos. angle | r | MU | MP |
| 98.79 | 508.52 | 91.97 | 481.13 | 13.73 | 173.62 | 57.94 | 284.71 | 0.8512 | -70.4 | -46.6 | |
|
previous
or next observation for the same group /
back to the solar disc SDO HMI 2010-11-17 22:58:57 UT
See sunspots with tool (Click here to study sunspot positions and configurations with tool using white-light and magnetogram images and polarity drawing) (It is recommended to set high resolution on your display!) |
| spot | Proj. U | Proj. WS | Corr. U | Corr. WS | B | L | LCM | Pos. angle | r | MU | MP |
| 43.78 | 289.89 | 45.23 | 298.92 | 12.93 | 176.85 | 61.17 | 283.35 | 0.8796 | -711.4 | -217.3 | |
| 0.00 | 1.20 | 0.00 | 1.20 | 12.12 | 175.77 | 60.10 | 282.52 | 0.8702 | -703.0 | -561.7 | |
| 3.09 | -1.00 | 3.11 | -1.00 | 12.99 | 175.99 | 60.32 | 283.50 | 0.8726 | -903.4 | 999999 | |
| 2.23 | -1.00 | 2.22 | -1.00 | 12.82 | 175.56 | 59.88 | 283.34 | 0.8689 | -762.7 | 999999 | |
| 0.00 | 0.69 | 0.00 | 0.66 | 11.43 | 174.63 | 58.95 | 281.82 | 0.8600 | -495.0 | -411.4 | |
| 0.00 | 1.03 | 0.00 | 0.99 | 11.56 | 174.61 | 58.93 | 281.96 | 0.8599 | -555.0 | -455.3 | |
| 0.00 | 2.40 | 0.00 | 2.35 | 12.69 | 174.96 | 59.29 | 283.25 | 0.8637 | -669.0 | -571.0 | |
| 0.34 | 1.80 | 0.33 | 1.73 | 12.41 | 174.32 | 58.65 | 282.98 | 0.8580 | -705.0 | -609.1 | |
| 0.00 | 0.94 | 0.00 | 0.90 | 12.85 | 174.07 | 58.40 | 283.51 | 0.8561 | 126.0 | 42.4 | |
| 0.00 | 1.03 | 0.00 | 0.97 | 12.92 | 173.75 | 58.08 | 283.63 | 0.8533 | 313.0 | 238.1 | |
| 0.00 | 0.60 | 0.00 | 0.56 | 13.51 | 173.34 | 57.66 | 284.36 | 0.8502 | -514.0 | -465.3 | |
| 0.00 | 0.86 | 0.00 | 0.79 | 13.34 | 172.93 | 57.26 | 284.21 | 0.8464 | -372.0 | -385.8 | |
| 0.34 | 2.40 | 0.32 | 2.22 | 12.96 | 172.73 | 57.06 | 283.78 | 0.8442 | 440.8 | 258.3 | |
| 0.00 | 0.77 | 0.00 | 0.71 | 13.23 | 172.67 | 56.99 | 284.11 | 0.8439 | 169.0 | 108.0 | |
| 0.00 | 1.20 | 0.00 | 1.09 | 13.24 | 172.39 | 56.71 | 284.15 | 0.8413 | 238.0 | 204.6 | |
| 2.23 | 3.00 | 2.02 | 2.72 | 13.25 | 172.11 | 56.44 | 284.20 | 0.8388 | 363.9 | 289.4 | |
| 1.89 | 3.52 | 1.70 | 3.16 | 13.26 | 171.84 | 56.17 | 284.24 | 0.8363 | 371.0 | 269.3 | |
| 0.00 | 1.12 | 0.00 | 0.99 | 12.79 | 171.46 | 55.78 | 283.72 | 0.8323 | 409.0 | 296.5 | |
| 0.86 | 2.49 | 0.76 | 2.22 | 13.30 | 171.53 | 55.85 | 284.33 | 0.8334 | 575.7 | 440.9 | |
| 0.00 | 0.94 | 0.00 | 0.83 | 13.17 | 171.05 | 55.37 | 284.23 | 0.8287 | 480.0 | 457.2 | |
| 0.00 | 1.29 | 0.00 | 1.15 | 14.34 | 171.36 | 55.68 | 285.59 | 0.8330 | 291.0 | 233.3 | |
| 0.26 | 3.00 | 0.23 | 2.64 | 13.44 | 171.03 | 55.36 | 284.56 | 0.8289 | 303.0 | 135.3 | |
| 1.37 | -22.00 | 1.21 | -22.00 | 13.45 | 170.93 | 55.25 | 284.57 | 0.8279 | -291.5 | 999999 | |
| 0.00 | 1.03 | 0.00 | 0.90 | 14.12 | 170.68 | 55.01 | 285.42 | 0.8263 | 502.0 | 382.8 | |
| 0.00 | 1.29 | 0.00 | 1.09 | 13.81 | 169.15 | 53.48 | 285.26 | 0.8112 | 437.0 | 342.2 | |
| 0.00 | 0.52 | 0.00 | 0.44 | 14.60 | 169.22 | 53.54 | 286.22 | 0.8128 | -7.0 | 4.5 | |
| 0.00 | 0.77 | 0.00 | 0.65 | 13.73 | 168.87 | 53.19 | 285.20 | 0.8083 | 427.0 | 377.7 | |
| 6.35 | 7.47 | 5.31 | 6.24 | 14.59 | 168.70 | 53.02 | 286.29 | 0.8077 | 473.9 | 440.1 | |
| 36.05 | 177.27 | 29.53 | 145.01 | 15.48 | 167.64 | 51.97 | 287.57 | 0.7985 | 837.6 | 304.8 | |
| Proj. U | - Projected umbra area in millionths of solar disc, negative values indicate | |
|
that the umbra consists of fragmented regions which cannot be separated without losing umbral area. In this way several spots (intensity minima in the umbra) have a common umbra, e.g. -2 means that the given spot shares an umbra with spot No.2, and the common U value is indicated at spot No.2. |
||
| Proj. WS | - Projected whole spot area in millionths of solar disc, negative values indicate | |
|
that several umbras have a common penumbra, e.g. -7 means that the given umbra shares a penumbra with umbra No.7, and the WS value is indicated at No.7. |
||
| Corr. U | - Corrected umbra area in millionths of solar hemisphere, for negative values see above | |
| Corr. WS | - Corrected whole spot area in millionths of solar hemisphere, for negative values see above | |
| B | - Heliographic latitude B; positive: North, negative: South | |
| L | - Heliographic longitude L | |
| LCM | - Longitudinal distance from the Sun's central meridian | |
| Pos. angle | - Position angle | |
| r | - Distance from the centre of Sun's disc in terms of Sun's radius | |
| MU | - Mean magnetic field within the umbra contour averaged the pixel values with sign. | |
| MP | - Mean magnetic field within the penumbra contour averaged the pixel values with sign. | |