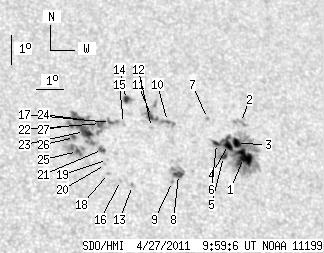
SDO HMI 2011-04-27 09:59:06 UT
See sunspots with tool (Click here to study sunspot positions and configurations with tool using white-light and magnetogram images and polarity drawing)
(It is recommended to set high resolution on your display!)
| group | Proj. U | Proj. WS | Corr. U | Corr. WS | B | L | LCM | Pos. angle | r | MU | MP |
| 79.33 | 280.32 | 49.23 | 174.10 | 20.71 | 188.59 | 27.52 | 314.19 | 0.6041 | -180.6 | -5.3 | |
|
previous
or next observation for the same group /
back to the solar disc SDO HMI 2011-04-27 09:59:06 UT
See sunspots with tool (Click here to study sunspot positions and configurations with tool using white-light and magnetogram images and polarity drawing) (It is recommended to set high resolution on your display!) |
| spot | Proj. U | Proj. WS | Corr. U | Corr. WS | B | L | LCM | Pos. angle | r | MU | MP |
| 18.34 | 124.71 | 11.63 | 79.07 | 20.33 | 191.17 | 30.09 | 311.14 | 0.6265 | -1063.3 | -364.3 | |
| 0.00 | 6.14 | 0.00 | 3.94 | 21.50 | 191.31 | 30.24 | 312.48 | 0.6377 | -625.0 | -486.3 | |
| 6.05 | -1.00 | 3.85 | -1.00 | 20.79 | 191.00 | 29.93 | 311.87 | 0.6287 | -790.8 | 999999 | |
| 5.61 | -1.00 | 3.55 | -1.00 | 20.74 | 190.70 | 29.62 | 312.09 | 0.6252 | -972.1 | 999999 | |
| 2.85 | -1.00 | 1.79 | -1.00 | 20.33 | 190.42 | 29.35 | 311.82 | 0.6190 | -873.0 | 999999 | |
| 2.49 | -1.00 | 1.57 | -1.00 | 20.76 | 190.25 | 29.18 | 312.52 | 0.6208 | -688.2 | 999999 | |
| 0.00 | 1.34 | 0.00 | 0.85 | 21.59 | 190.10 | 29.03 | 313.71 | 0.6264 | -731.0 | -603.3 | |
| 4.36 | 13.35 | 2.68 | 8.22 | 19.66 | 188.64 | 27.57 | 312.66 | 0.5950 | -969.7 | -465.5 | |
| 0.00 | 1.34 | 0.00 | 0.82 | 19.42 | 188.38 | 27.31 | 312.61 | 0.5901 | -848.0 | -648.5 | |
| 1.34 | 21.36 | 0.83 | 13.31 | 21.42 | 188.59 | 27.52 | 314.97 | 0.6102 | -672.1 | -291.8 | |
| 5.79 | -10.00 | 3.60 | -10.00 | 21.57 | 188.04 | 26.96 | 315.71 | 0.6061 | -763.0 | 999999 | |
| 0.00 | 1.34 | 0.00 | 0.83 | 21.20 | 187.96 | 26.89 | 315.33 | 0.6019 | -809.0 | -561.4 | |
| 0.00 | 1.60 | 0.00 | 0.97 | 19.24 | 186.92 | 25.84 | 313.88 | 0.5733 | 781.0 | 641.0 | |
| 3.65 | 5.70 | 2.26 | 3.53 | 22.11 | 187.23 | 26.16 | 317.21 | 0.6035 | 714.4 | 405.4 | |
| 0.00 | 2.14 | 0.00 | 1.31 | 21.30 | 186.97 | 25.89 | 316.49 | 0.5932 | 285.0 | 204.3 | |
| 0.00 | 1.16 | 0.00 | 0.70 | 19.39 | 186.52 | 25.44 | 314.52 | 0.5705 | 597.0 | 445.8 | |
| 1.87 | 70.32 | 1.14 | 42.66 | 21.31 | 186.50 | 25.43 | 317.01 | 0.5888 | 551.3 | 586.5 | |
| 0.00 | 1.42 | 0.00 | 0.86 | 19.60 | 186.13 | 25.06 | 315.23 | 0.5687 | 835.0 | 662.1 | |
| 0.00 | 0.80 | 0.00 | 0.48 | 20.07 | 186.17 | 25.10 | 315.79 | 0.5736 | 696.0 | 562.0 | |
| 0.00 | 0.98 | 0.00 | 0.59 | 19.90 | 186.07 | 25.00 | 315.68 | 0.5709 | 676.0 | 568.5 | |
| 3.29 | -17.00 | 1.99 | -17.00 | 20.40 | 186.05 | 24.98 | 316.35 | 0.5755 | 645.5 | 999999 | |
| 4.72 | -17.00 | 2.88 | -17.00 | 21.27 | 186.14 | 25.06 | 317.35 | 0.5849 | 706.9 | 999999 | |
| 11.13 | -17.00 | 6.73 | -17.00 | 20.98 | 185.51 | 24.44 | 317.69 | 0.5760 | 983.6 | 999999 | |
| 3.12 | -17.00 | 1.89 | -17.00 | 21.38 | 185.48 | 24.40 | 318.22 | 0.5797 | 596.1 | 999999 | |
| 1.78 | 19.50 | 1.07 | 11.68 | 20.30 | 185.15 | 24.08 | 317.24 | 0.5657 | 925.5 | 701.1 | |
| 1.60 | 7.12 | 0.96 | 4.28 | 20.76 | 185.12 | 24.05 | 317.86 | 0.5701 | 915.6 | 687.5 | |
| 1.34 | -17.00 | 0.81 | -17.00 | 21.16 | 185.08 | 24.01 | 318.41 | 0.5738 | 836.9 | 999999 | |
| Proj. U | - Projected umbra area in millionths of solar disc, negative values indicate | |
|
that the umbra consists of fragmented regions which cannot be separated without losing umbral area. In this way several spots (intensity minima in the umbra) have a common umbra, e.g. -2 means that the given spot shares an umbra with spot No.2, and the common U value is indicated at spot No.2. |
||
| Proj. WS | - Projected whole spot area in millionths of solar disc, negative values indicate | |
|
that several umbras have a common penumbra, e.g. -7 means that the given umbra shares a penumbra with umbra No.7, and the WS value is indicated at No.7. |
||
| Corr. U | - Corrected umbra area in millionths of solar hemisphere, for negative values see above | |
| Corr. WS | - Corrected whole spot area in millionths of solar hemisphere, for negative values see above | |
| B | - Heliographic latitude B; positive: North, negative: South | |
| L | - Heliographic longitude L | |
| LCM | - Longitudinal distance from the Sun's central meridian | |
| Pos. angle | - Position angle | |
| r | - Distance from the centre of Sun's disc in terms of Sun's radius | |
| MU | - Mean magnetic field within the umbra contour averaged the pixel values with sign. | |
| MP | - Mean magnetic field within the penumbra contour averaged the pixel values with sign. | |